Zip Codes with the Highest Percentage of Population Employed in Farming, Fishing & Forestry in Belleville, IL
RELATED REPORTS & OPTIONS
Farming, Fishing & Forestry
Belleville
Compare Zip Codes
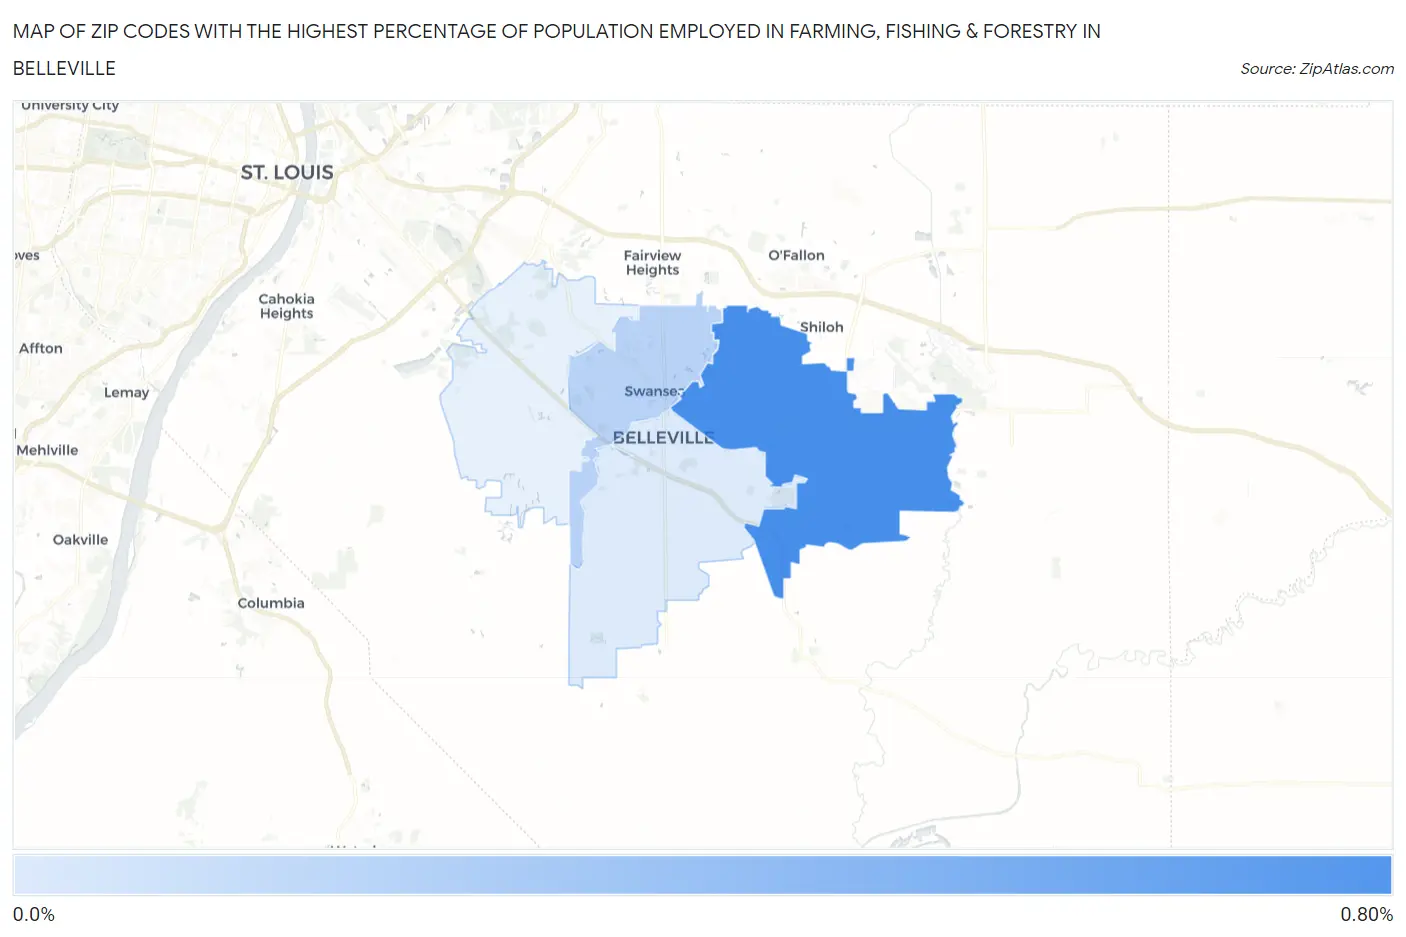
Map of Zip Codes with the Highest Percentage of Population Employed in Farming, Fishing & Forestry in Belleville
0.065%
0.71%
Zip Codes with the Highest Percentage of Population Employed in Farming, Fishing & Forestry in Belleville, IL
| Zip Code | % Employed | vs State | vs National | |
| 1. | 62221 | 0.71% | 0.31%(+0.400)#500 | 0.61%(+0.105)#11,308 |
| 2. | 62226 | 0.23% | 0.31%(-0.083)#696 | 0.61%(-0.378)#15,729 |
| 3. | 62220 | 0.065% | 0.31%(-0.245)#801 | 0.61%(-0.540)#18,378 |
1
Common Questions
What are the Top 3 Zip Codes with the Highest Percentage of Population Employed in Farming, Fishing & Forestry in Belleville, IL?
Top 3 Zip Codes with the Highest Percentage of Population Employed in Farming, Fishing & Forestry in Belleville, IL are:
What zip code has the Highest Percentage of Population Employed in Farming, Fishing & Forestry in Belleville, IL?
62221 has the Highest Percentage of Population Employed in Farming, Fishing & Forestry in Belleville, IL with 0.71%.
What is the Percentage of Population Employed in Farming, Fishing & Forestry in Belleville, IL?
Percentage of Population Employed in Farming, Fishing & Forestry in Belleville is 0.063%.
What is the Percentage of Population Employed in Farming, Fishing & Forestry in Illinois?
Percentage of Population Employed in Farming, Fishing & Forestry in Illinois is 0.31%.
What is the Percentage of Population Employed in Farming, Fishing & Forestry in the United States?
Percentage of Population Employed in Farming, Fishing & Forestry in the United States is 0.61%.