Zip Codes with the Highest Percentage of Population Employed in Installation, Maintenance & Repair in Cedar Rapids, IA
RELATED REPORTS & OPTIONS
Installation, Maintenance & Repair
Cedar Rapids
Compare Zip Codes
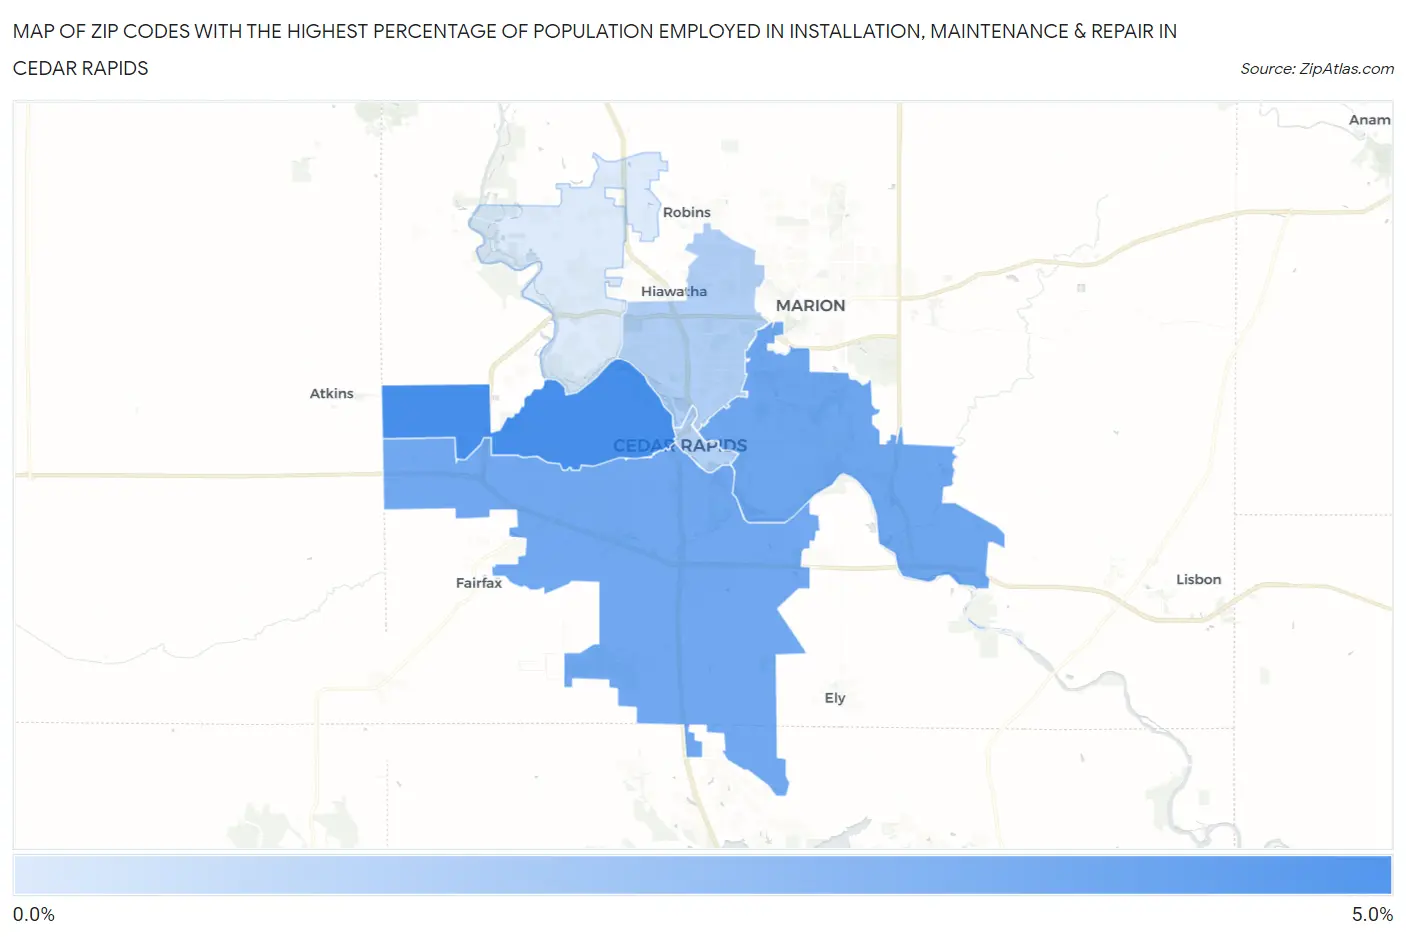
Map of Zip Codes with the Highest Percentage of Population Employed in Installation, Maintenance & Repair in Cedar Rapids
0.47%
4.4%
Zip Codes with the Highest Percentage of Population Employed in Installation, Maintenance & Repair in Cedar Rapids, IA
| Zip Code | % Employed | vs State | vs National | |
| 1. | 52405 | 4.4% | 3.5%(+0.947)#434 | 3.1%(+1.35)#10,719 |
| 2. | 52403 | 3.4% | 3.5%(-0.100)#582 | 3.1%(+0.298)#15,253 |
| 3. | 52404 | 3.3% | 3.5%(-0.154)#591 | 3.1%(+0.245)#15,488 |
| 4. | 52402 | 1.6% | 3.5%(-1.87)#790 | 3.1%(-1.48)#23,804 |
| 5. | 52401 | 1.6% | 3.5%(-1.89)#792 | 3.1%(-1.49)#23,868 |
| 6. | 52411 | 0.47% | 3.5%(-2.99)#882 | 3.1%(-2.59)#27,263 |
1
Common Questions
What are the Top 5 Zip Codes with the Highest Percentage of Population Employed in Installation, Maintenance & Repair in Cedar Rapids, IA?
Top 5 Zip Codes with the Highest Percentage of Population Employed in Installation, Maintenance & Repair in Cedar Rapids, IA are:
What zip code has the Highest Percentage of Population Employed in Installation, Maintenance & Repair in Cedar Rapids, IA?
52405 has the Highest Percentage of Population Employed in Installation, Maintenance & Repair in Cedar Rapids, IA with 4.4%.
What is the Percentage of Population Employed in Installation, Maintenance & Repair in Cedar Rapids, IA?
Percentage of Population Employed in Installation, Maintenance & Repair in Cedar Rapids is 2.8%.
What is the Percentage of Population Employed in Installation, Maintenance & Repair in Iowa?
Percentage of Population Employed in Installation, Maintenance & Repair in Iowa is 3.5%.
What is the Percentage of Population Employed in Installation, Maintenance & Repair in the United States?
Percentage of Population Employed in Installation, Maintenance & Repair in the United States is 3.1%.