Zip Codes with the Highest Percentage of Population with a Degree in Liberal Arts and History in Marietta, GA
RELATED REPORTS & OPTIONS
Liberal Arts and History
Marietta
Compare Zip Codes
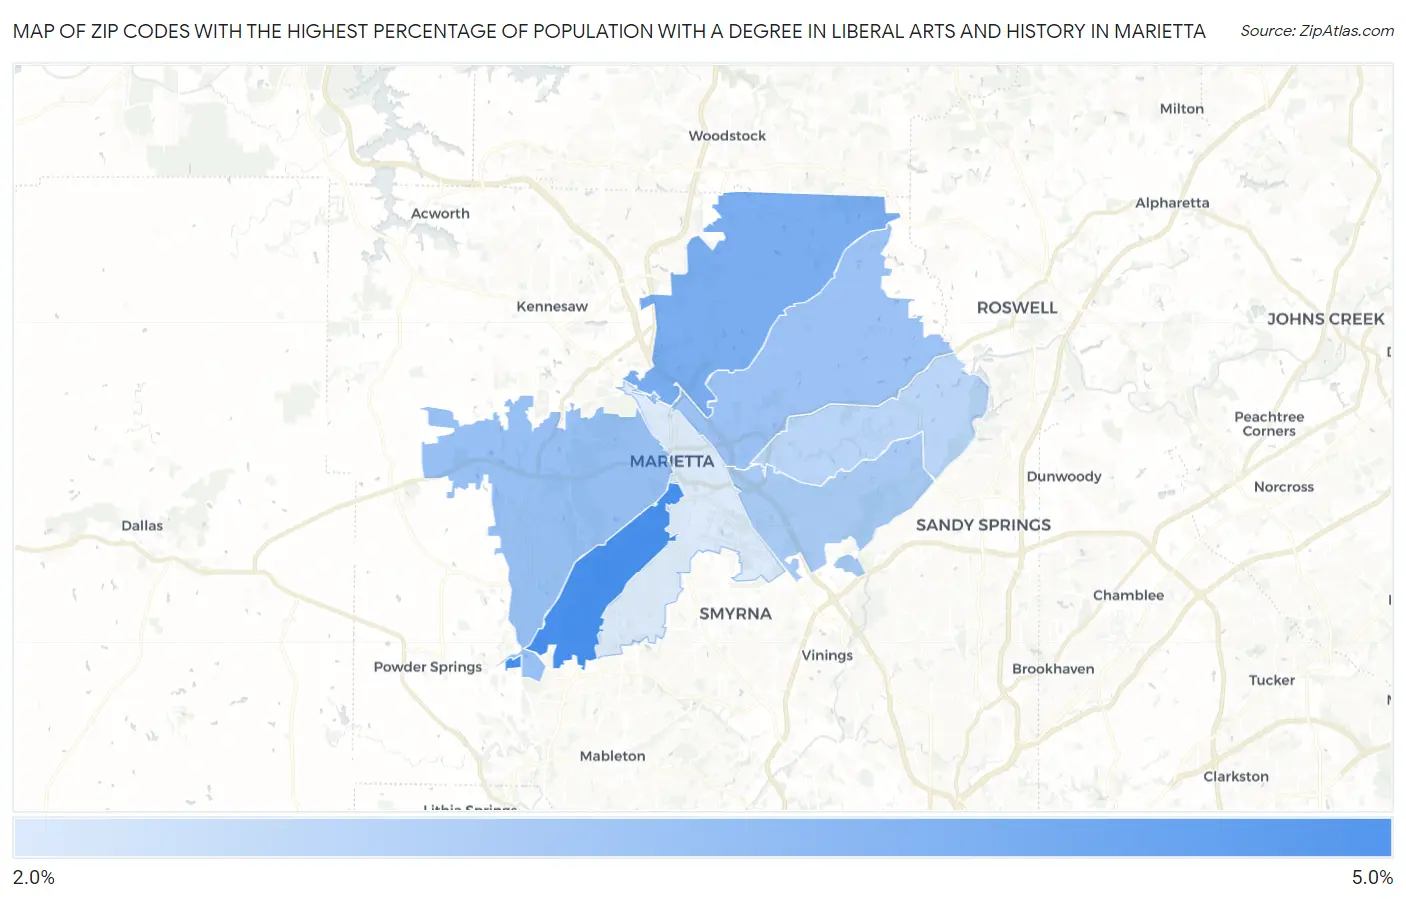
Map of Zip Codes with the Highest Percentage of Population with a Degree in Liberal Arts and History in Marietta
2.5%
5.0%
Zip Codes with the Highest Percentage of Population with a Degree in Liberal Arts and History in Marietta, GA
| Zip Code | % Graduates | vs State | vs National | |
| 1. | 30008 | 5.0% | 4.1%(+0.865)#224 | 4.9%(+0.118)#11,387 |
| 2. | 30066 | 4.1% | 4.1%(+0.015)#302 | 4.9%(-0.731)#14,237 |
| 3. | 30064 | 3.6% | 4.1%(-0.478)#351 | 4.9%(-1.22)#16,074 |
| 4. | 30062 | 3.6% | 4.1%(-0.571)#364 | 4.9%(-1.32)#16,395 |
| 5. | 30067 | 3.3% | 4.1%(-0.786)#379 | 4.9%(-1.53)#17,169 |
| 6. | 30068 | 3.1% | 4.1%(-1.07)#413 | 4.9%(-1.81)#18,130 |
| 7. | 30060 | 2.5% | 4.1%(-1.65)#454 | 4.9%(-2.40)#20,066 |
1
Common Questions
What are the Top 5 Zip Codes with the Highest Percentage of Population with a Degree in Liberal Arts and History in Marietta, GA?
Top 5 Zip Codes with the Highest Percentage of Population with a Degree in Liberal Arts and History in Marietta, GA are:
What zip code has the Highest Percentage of Population with a Degree in Liberal Arts and History in Marietta, GA?
30008 has the Highest Percentage of Population with a Degree in Liberal Arts and History in Marietta, GA with 5.0%.
What is the Percentage of Population with a Degree in Liberal Arts and History in Marietta, GA?
Percentage of Population with a Degree in Liberal Arts and History in Marietta is 5.2%.
What is the Percentage of Population with a Degree in Liberal Arts and History in Georgia?
Percentage of Population with a Degree in Liberal Arts and History in Georgia is 4.1%.
What is the Percentage of Population with a Degree in Liberal Arts and History in the United States?
Percentage of Population with a Degree in Liberal Arts and History in the United States is 4.9%.