Zip Codes with the Highest Percentage of Population with a Degree in Liberal Arts and History in Carrollton, GA
RELATED REPORTS & OPTIONS
Liberal Arts and History
Carrollton
Compare Zip Codes
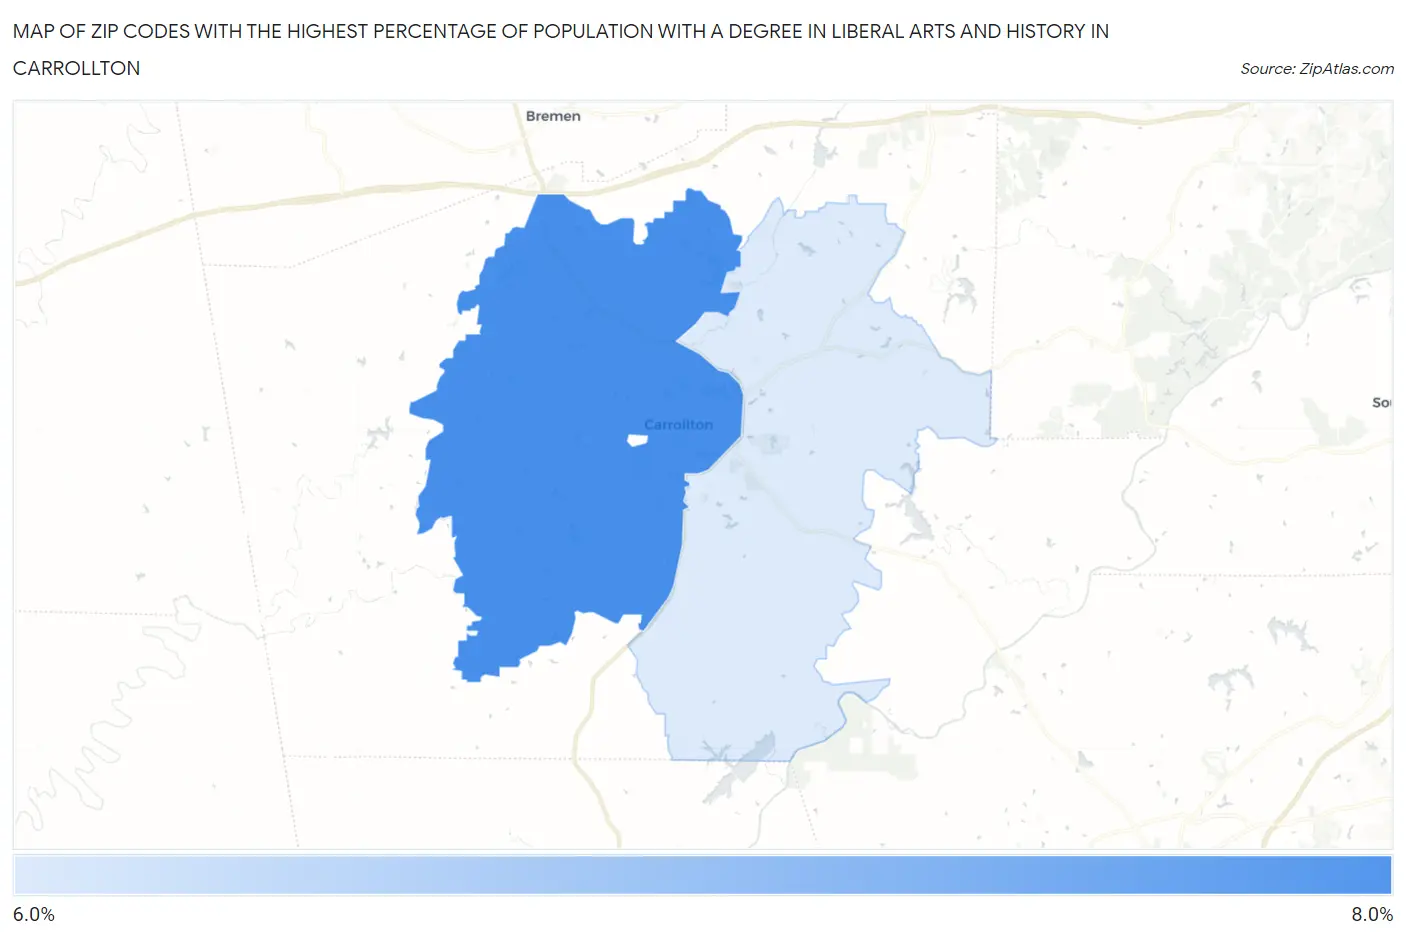
Map of Zip Codes with the Highest Percentage of Population with a Degree in Liberal Arts and History in Carrollton
6.6%
7.3%
Zip Codes with the Highest Percentage of Population with a Degree in Liberal Arts and History in Carrollton, GA
| Zip Code | % Graduates | vs State | vs National | |
| 1. | 30117 | 7.3% | 4.1%(+3.20)#112 | 4.9%(+2.45)#5,843 |
| 2. | 30116 | 6.6% | 4.1%(+2.43)#138 | 4.9%(+1.69)#7,230 |
1
Common Questions
What are the Top Zip Codes with the Highest Percentage of Population with a Degree in Liberal Arts and History in Carrollton, GA?
Top Zip Codes with the Highest Percentage of Population with a Degree in Liberal Arts and History in Carrollton, GA are:
What zip code has the Highest Percentage of Population with a Degree in Liberal Arts and History in Carrollton, GA?
30117 has the Highest Percentage of Population with a Degree in Liberal Arts and History in Carrollton, GA with 7.3%.
What is the Percentage of Population with a Degree in Liberal Arts and History in Carrollton, GA?
Percentage of Population with a Degree in Liberal Arts and History in Carrollton is 7.9%.
What is the Percentage of Population with a Degree in Liberal Arts and History in Georgia?
Percentage of Population with a Degree in Liberal Arts and History in Georgia is 4.1%.
What is the Percentage of Population with a Degree in Liberal Arts and History in the United States?
Percentage of Population with a Degree in Liberal Arts and History in the United States is 4.9%.