Zip Codes with the Highest Percentage of Population with a Degree in Liberal Arts and History in Alpharetta, GA
RELATED REPORTS & OPTIONS
Liberal Arts and History
Alpharetta
Compare Zip Codes
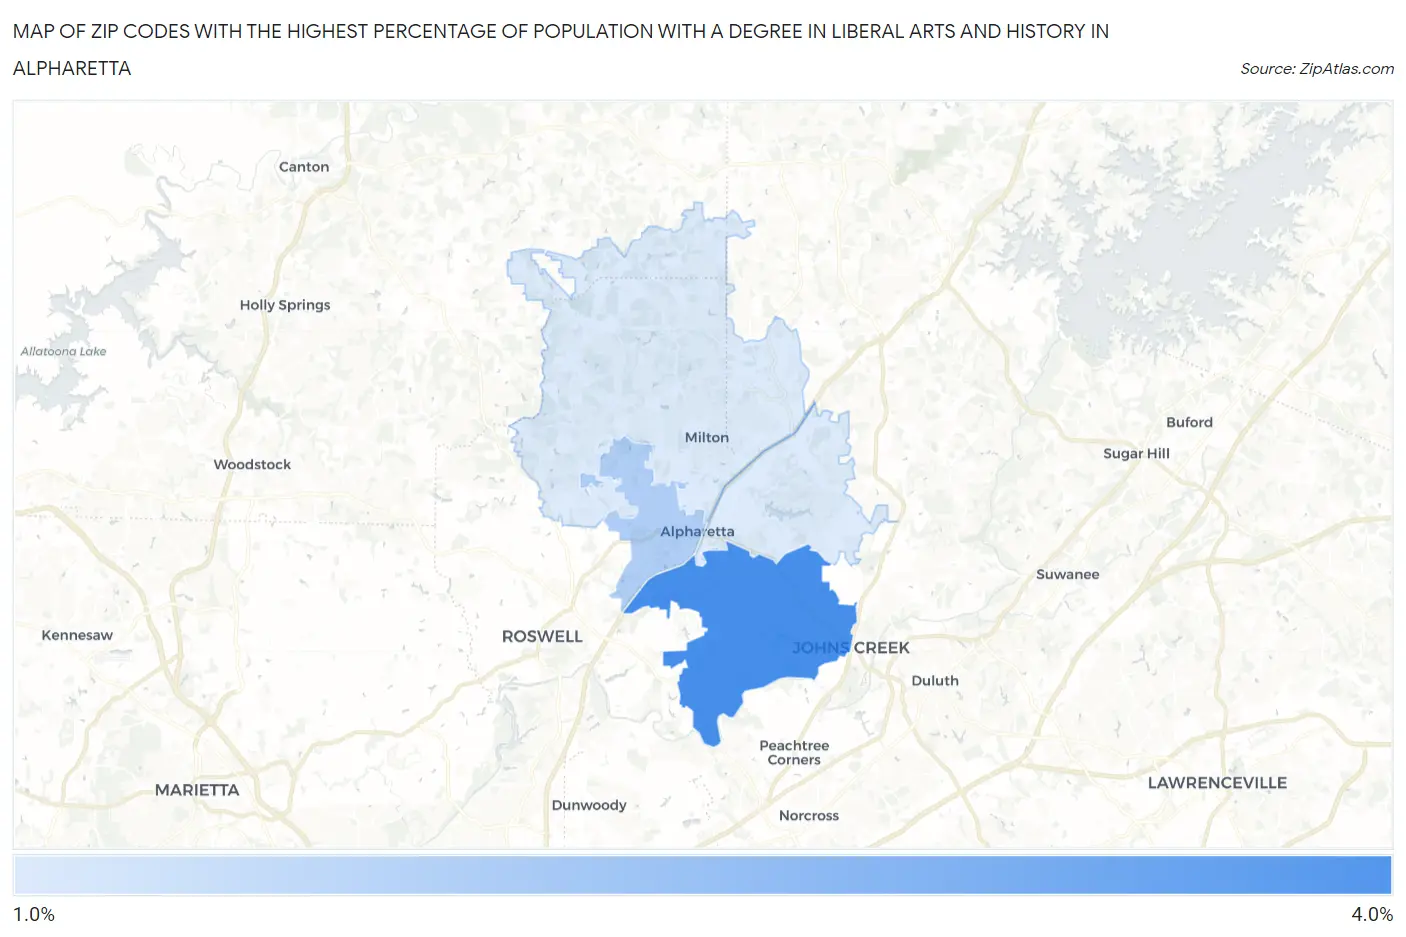
Map of Zip Codes with the Highest Percentage of Population with a Degree in Liberal Arts and History in Alpharetta
1.8%
3.7%
Zip Codes with the Highest Percentage of Population with a Degree in Liberal Arts and History in Alpharetta, GA
| Zip Code | % Graduates | vs State | vs National | |
| 1. | 30022 | 3.7% | 4.1%(-0.393)#347 | 4.9%(-1.14)#15,769 |
| 2. | 30009 | 2.4% | 4.1%(-1.70)#457 | 4.9%(-2.44)#20,197 |
| 3. | 30004 | 1.9% | 4.1%(-2.26)#495 | 4.9%(-3.01)#21,694 |
| 4. | 30005 | 1.8% | 4.1%(-2.28)#498 | 4.9%(-3.02)#21,725 |
1
Common Questions
What are the Top 3 Zip Codes with the Highest Percentage of Population with a Degree in Liberal Arts and History in Alpharetta, GA?
Top 3 Zip Codes with the Highest Percentage of Population with a Degree in Liberal Arts and History in Alpharetta, GA are:
What zip code has the Highest Percentage of Population with a Degree in Liberal Arts and History in Alpharetta, GA?
30022 has the Highest Percentage of Population with a Degree in Liberal Arts and History in Alpharetta, GA with 3.7%.
What is the Percentage of Population with a Degree in Liberal Arts and History in Alpharetta, GA?
Percentage of Population with a Degree in Liberal Arts and History in Alpharetta is 2.7%.
What is the Percentage of Population with a Degree in Liberal Arts and History in Georgia?
Percentage of Population with a Degree in Liberal Arts and History in Georgia is 4.1%.
What is the Percentage of Population with a Degree in Liberal Arts and History in the United States?
Percentage of Population with a Degree in Liberal Arts and History in the United States is 4.9%.