Zip Codes with the Highest Percentage of Population with a Degree in Liberal Arts and History in Griffin, GA
RELATED REPORTS & OPTIONS
Liberal Arts and History
Griffin
Compare Zip Codes
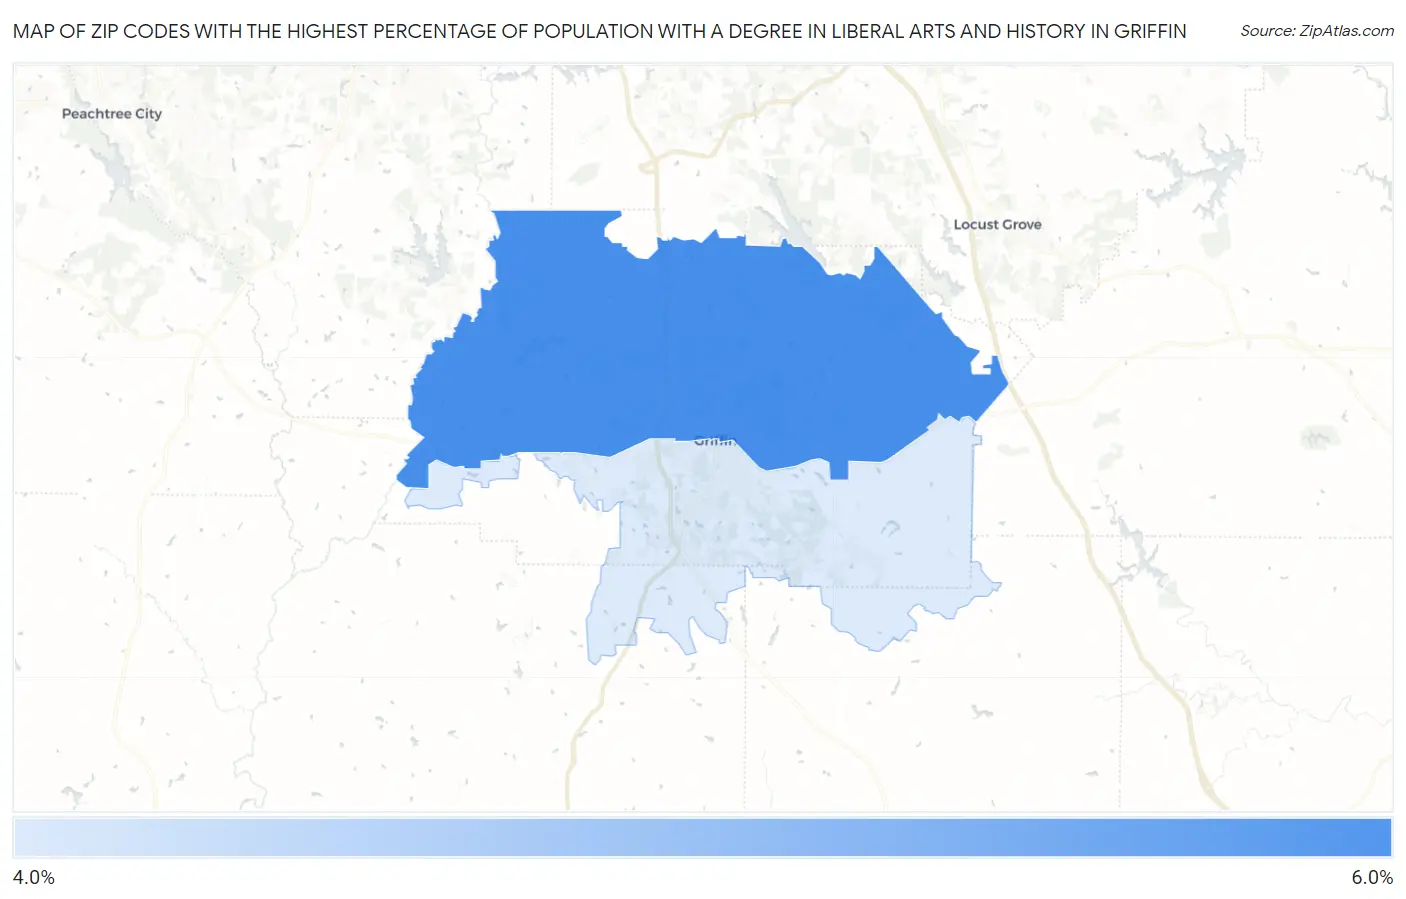
Map of Zip Codes with the Highest Percentage of Population with a Degree in Liberal Arts and History in Griffin
4.0%
5.9%
Zip Codes with the Highest Percentage of Population with a Degree in Liberal Arts and History in Griffin, GA
| Zip Code | % Graduates | vs State | vs National | |
| 1. | 30223 | 5.9% | 4.1%(+1.75)#166 | 4.9%(+1.01)#8,843 |
| 2. | 30224 | 4.0% | 4.1%(-0.111)#315 | 4.9%(-0.857)#14,719 |
1
Common Questions
What are the Top Zip Codes with the Highest Percentage of Population with a Degree in Liberal Arts and History in Griffin, GA?
Top Zip Codes with the Highest Percentage of Population with a Degree in Liberal Arts and History in Griffin, GA are:
What zip code has the Highest Percentage of Population with a Degree in Liberal Arts and History in Griffin, GA?
30223 has the Highest Percentage of Population with a Degree in Liberal Arts and History in Griffin, GA with 5.9%.
What is the Percentage of Population with a Degree in Liberal Arts and History in Griffin, GA?
Percentage of Population with a Degree in Liberal Arts and History in Griffin is 4.3%.
What is the Percentage of Population with a Degree in Liberal Arts and History in Georgia?
Percentage of Population with a Degree in Liberal Arts and History in Georgia is 4.1%.
What is the Percentage of Population with a Degree in Liberal Arts and History in the United States?
Percentage of Population with a Degree in Liberal Arts and History in the United States is 4.9%.