Peruvian vs Immigrants from Fiji Married-couple Households
COMPARE
Peruvian
Immigrants from Fiji
Married-couple Households
Married-couple Households Comparison
Peruvians
Immigrants from Fiji
47.6%
MARRIED-COUPLE HOUSEHOLDS
93.8/ 100
METRIC RATING
112th/ 347
METRIC RANK
48.2%
MARRIED-COUPLE HOUSEHOLDS
98.4/ 100
METRIC RATING
76th/ 347
METRIC RANK
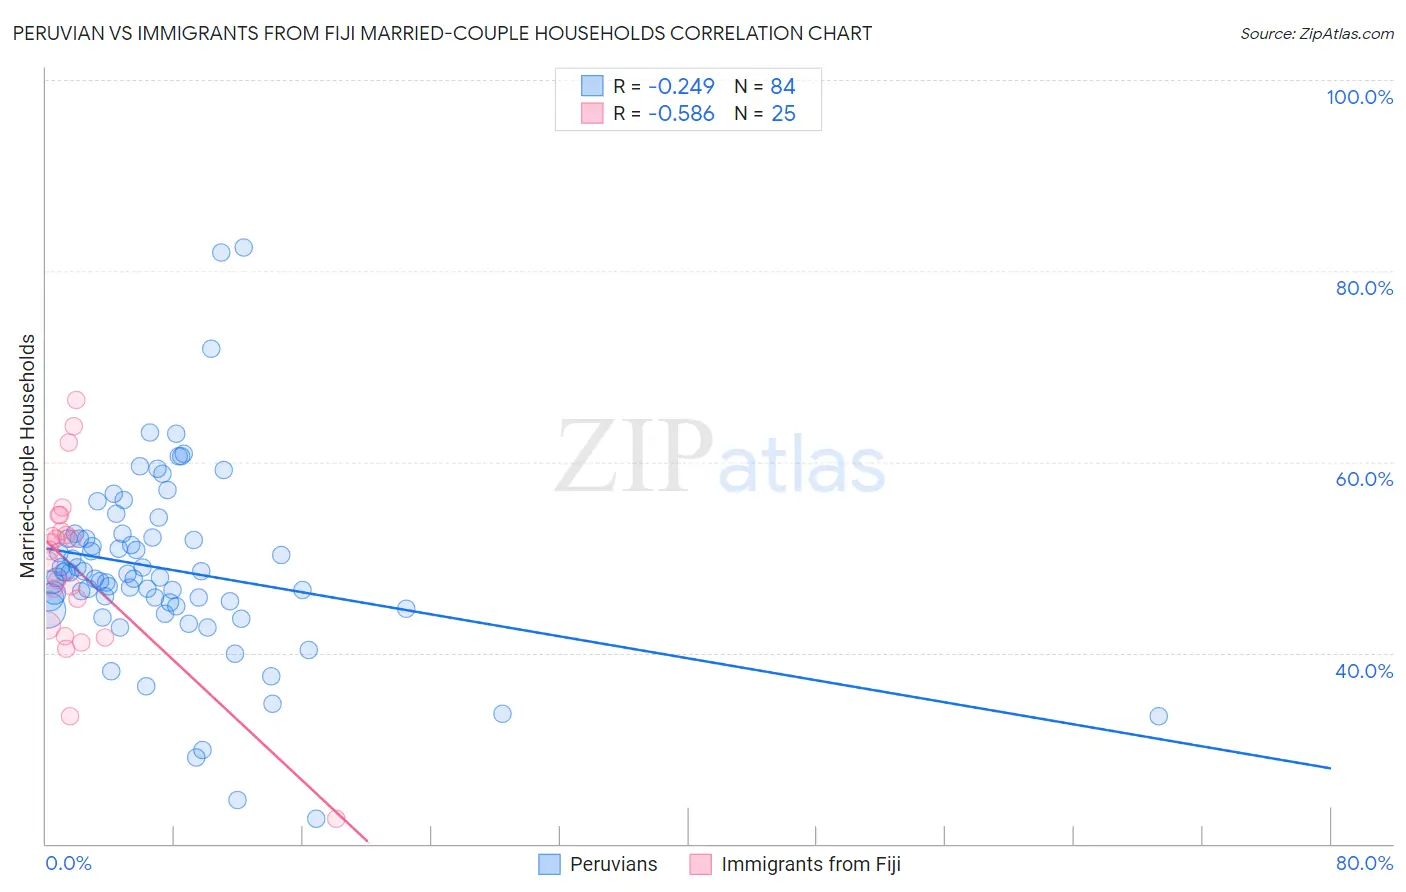
Peruvian vs Immigrants from Fiji Married-couple Households Correlation Chart
The statistical analysis conducted on geographies consisting of 362,959,523 people shows a weak negative correlation between the proportion of Peruvians and percentage of married-couple family households in the United States with a correlation coefficient (R) of -0.249 and weighted average of 47.6%. Similarly, the statistical analysis conducted on geographies consisting of 93,754,900 people shows a substantial negative correlation between the proportion of Immigrants from Fiji and percentage of married-couple family households in the United States with a correlation coefficient (R) of -0.586 and weighted average of 48.2%, a difference of 1.3%.
Married-couple Households Correlation Summary
| Measurement | Peruvian | Immigrants from Fiji |
| Minimum | 22.6% | 22.7% |
| Maximum | 82.5% | 66.5% |
| Range | 60.0% | 43.8% |
| Mean | 48.8% | 48.8% |
| Median | 48.1% | 50.7% |
| Interquartile 25% (IQ1) | 45.0% | 42.3% |
| Interquartile 75% (IQ3) | 52.0% | 53.6% |
| Interquartile Range (IQR) | 7.0% | 11.2% |
| Standard Deviation (Sample) | 9.8% | 9.3% |
| Standard Deviation (Population) | 9.8% | 9.1% |
Similar Demographics by Married-couple Households
Demographics Similar to Peruvians by Married-couple Households
In terms of married-couple households, the demographic groups most similar to Peruvians are Syrian (47.6%, a difference of 0.010%), Venezuelan (47.6%, a difference of 0.010%), Macedonian (47.6%, a difference of 0.020%), Immigrants from Europe (47.6%, a difference of 0.020%), and Immigrants from Jordan (47.7%, a difference of 0.040%).
| Demographics | Rating | Rank | Married-couple Households |
| Immigrants | Czechoslovakia | 95.5 /100 | #105 | Exceptional 47.8% |
| Portuguese | 95.5 /100 | #106 | Exceptional 47.8% |
| Estonians | 94.7 /100 | #107 | Exceptional 47.7% |
| Immigrants | Japan | 94.4 /100 | #108 | Exceptional 47.7% |
| Immigrants | Jordan | 94.1 /100 | #109 | Exceptional 47.7% |
| Macedonians | 93.9 /100 | #110 | Exceptional 47.6% |
| Syrians | 93.9 /100 | #111 | Exceptional 47.6% |
| Peruvians | 93.8 /100 | #112 | Exceptional 47.6% |
| Venezuelans | 93.8 /100 | #113 | Exceptional 47.6% |
| Immigrants | Europe | 93.7 /100 | #114 | Exceptional 47.6% |
| Slovaks | 92.9 /100 | #115 | Exceptional 47.6% |
| Argentineans | 92.5 /100 | #116 | Exceptional 47.5% |
| French Canadians | 92.4 /100 | #117 | Exceptional 47.5% |
| Immigrants | Germany | 92.4 /100 | #118 | Exceptional 47.5% |
| Chileans | 92.2 /100 | #119 | Exceptional 47.5% |
Demographics Similar to Immigrants from Fiji by Married-couple Households
In terms of married-couple households, the demographic groups most similar to Immigrants from Fiji are Immigrants from England (48.2%, a difference of 0.0%), Immigrants from Romania (48.3%, a difference of 0.090%), Immigrants from Singapore (48.3%, a difference of 0.10%), Canadian (48.2%, a difference of 0.10%), and Egyptian (48.2%, a difference of 0.12%).
| Demographics | Rating | Rank | Married-couple Households |
| Immigrants | China | 98.9 /100 | #69 | Exceptional 48.4% |
| Immigrants | North America | 98.9 /100 | #70 | Exceptional 48.4% |
| Laotians | 98.8 /100 | #71 | Exceptional 48.4% |
| Scotch-Irish | 98.6 /100 | #72 | Exceptional 48.3% |
| Immigrants | Singapore | 98.6 /100 | #73 | Exceptional 48.3% |
| Immigrants | Romania | 98.6 /100 | #74 | Exceptional 48.3% |
| Immigrants | England | 98.4 /100 | #75 | Exceptional 48.2% |
| Immigrants | Fiji | 98.4 /100 | #76 | Exceptional 48.2% |
| Canadians | 98.2 /100 | #77 | Exceptional 48.2% |
| Egyptians | 98.2 /100 | #78 | Exceptional 48.2% |
| Immigrants | Netherlands | 98.2 /100 | #79 | Exceptional 48.2% |
| Russians | 98.1 /100 | #80 | Exceptional 48.2% |
| Finns | 98.0 /100 | #81 | Exceptional 48.1% |
| Immigrants | Poland | 97.7 /100 | #82 | Exceptional 48.1% |
| Guamanians/Chamorros | 97.6 /100 | #83 | Exceptional 48.1% |