Nepalese vs Lithuanian Married-couple Households
COMPARE
Nepalese
Lithuanian
Married-couple Households
Married-couple Households Comparison
Nepalese
Lithuanians
45.6%
MARRIED-COUPLE HOUSEHOLDS
11.9/ 100
METRIC RATING
205th/ 347
METRIC RANK
48.9%
MARRIED-COUPLE HOUSEHOLDS
99.6/ 100
METRIC RATING
39th/ 347
METRIC RANK
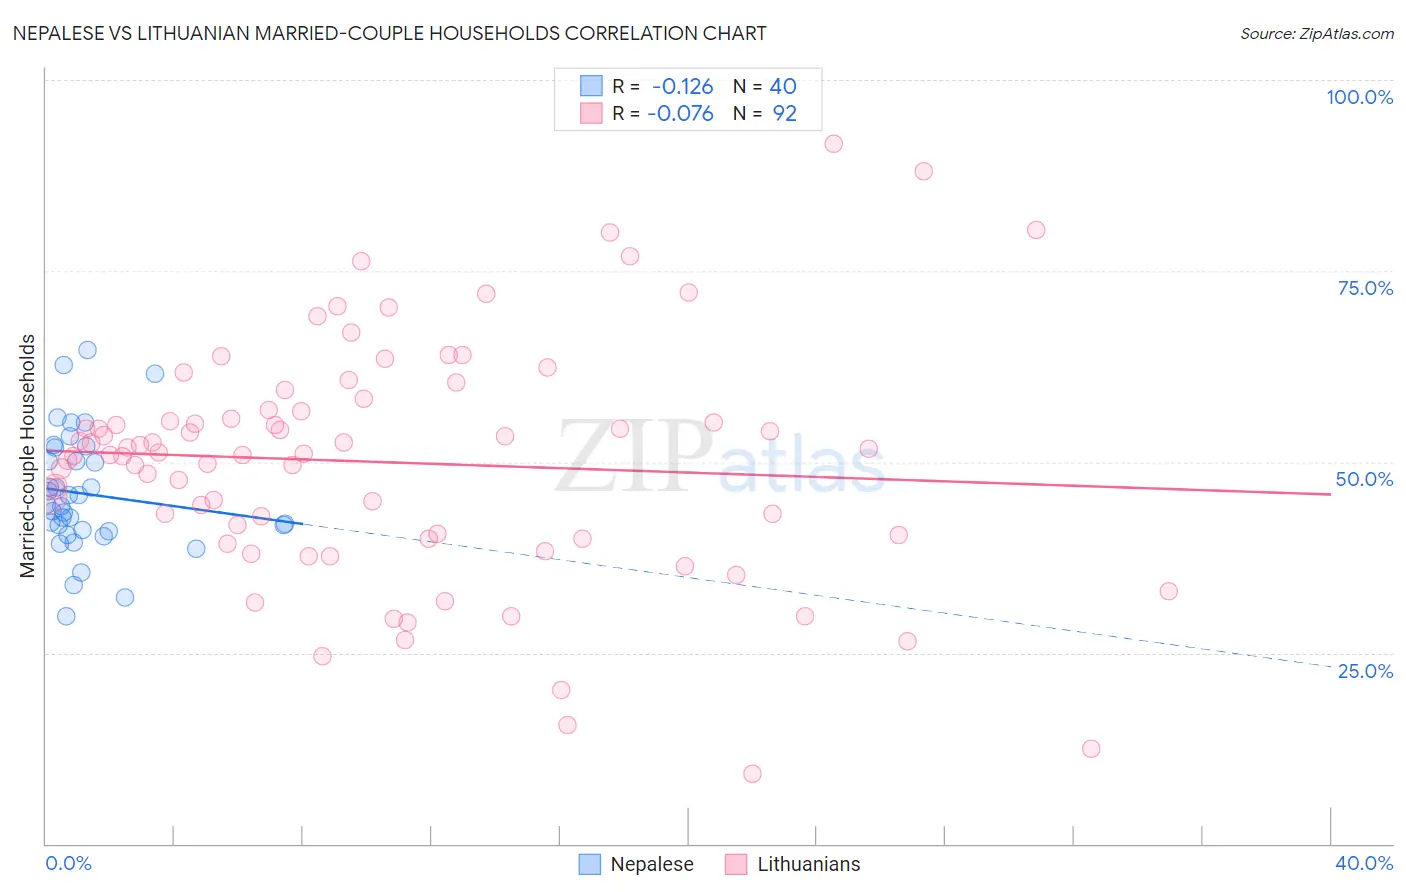
Nepalese vs Lithuanian Married-couple Households Correlation Chart
The statistical analysis conducted on geographies consisting of 24,521,755 people shows a poor negative correlation between the proportion of Nepalese and percentage of married-couple family households in the United States with a correlation coefficient (R) of -0.126 and weighted average of 45.6%. Similarly, the statistical analysis conducted on geographies consisting of 421,720,983 people shows a slight negative correlation between the proportion of Lithuanians and percentage of married-couple family households in the United States with a correlation coefficient (R) of -0.076 and weighted average of 48.9%, a difference of 7.3%.
Married-couple Households Correlation Summary
| Measurement | Nepalese | Lithuanian |
| Minimum | 29.7% | 9.2% |
| Maximum | 64.6% | 91.7% |
| Range | 34.9% | 82.5% |
| Mean | 45.8% | 49.9% |
| Median | 44.3% | 51.1% |
| Interquartile 25% (IQ1) | 41.0% | 40.2% |
| Interquartile 75% (IQ3) | 51.0% | 56.7% |
| Interquartile Range (IQR) | 10.0% | 16.5% |
| Standard Deviation (Sample) | 7.9% | 15.6% |
| Standard Deviation (Population) | 7.8% | 15.5% |
Similar Demographics by Married-couple Households
Demographics Similar to Nepalese by Married-couple Households
In terms of married-couple households, the demographic groups most similar to Nepalese are Aleut (45.6%, a difference of 0.050%), Alaska Native (45.6%, a difference of 0.10%), Uruguayan (45.5%, a difference of 0.14%), Immigrants from Central America (45.7%, a difference of 0.19%), and Immigrants from Serbia (45.7%, a difference of 0.27%).
| Demographics | Rating | Rank | Married-couple Households |
| Ottawa | 19.4 /100 | #198 | Poor 45.8% |
| Carpatho Rusyns | 15.7 /100 | #199 | Poor 45.7% |
| Potawatomi | 15.6 /100 | #200 | Poor 45.7% |
| Immigrants | Serbia | 15.2 /100 | #201 | Poor 45.7% |
| Immigrants | Central America | 14.2 /100 | #202 | Poor 45.7% |
| Alaska Natives | 13.0 /100 | #203 | Poor 45.6% |
| Aleuts | 12.5 /100 | #204 | Poor 45.6% |
| Nepalese | 11.9 /100 | #205 | Poor 45.6% |
| Uruguayans | 10.4 /100 | #206 | Poor 45.5% |
| Immigrants | France | 8.8 /100 | #207 | Tragic 45.4% |
| Hispanics or Latinos | 8.7 /100 | #208 | Tragic 45.4% |
| Immigrants | Uzbekistan | 8.4 /100 | #209 | Tragic 45.4% |
| Cubans | 7.7 /100 | #210 | Tragic 45.4% |
| Immigrants | Spain | 7.3 /100 | #211 | Tragic 45.3% |
| Creek | 6.4 /100 | #212 | Tragic 45.3% |
Demographics Similar to Lithuanians by Married-couple Households
In terms of married-couple households, the demographic groups most similar to Lithuanians are Immigrants from Bolivia (48.9%, a difference of 0.010%), Immigrants from Lebanon (48.9%, a difference of 0.050%), Greek (48.9%, a difference of 0.080%), Immigrants from Vietnam (48.8%, a difference of 0.090%), and Immigrants from Iran (48.8%, a difference of 0.15%).
| Demographics | Rating | Rank | Married-couple Households |
| Hungarians | 99.8 /100 | #32 | Exceptional 49.1% |
| Immigrants | Asia | 99.7 /100 | #33 | Exceptional 49.1% |
| Italians | 99.7 /100 | #34 | Exceptional 49.0% |
| Scottish | 99.7 /100 | #35 | Exceptional 49.0% |
| Iranians | 99.7 /100 | #36 | Exceptional 49.0% |
| Sri Lankans | 99.7 /100 | #37 | Exceptional 49.0% |
| Greeks | 99.7 /100 | #38 | Exceptional 48.9% |
| Lithuanians | 99.6 /100 | #39 | Exceptional 48.9% |
| Immigrants | Bolivia | 99.6 /100 | #40 | Exceptional 48.9% |
| Immigrants | Lebanon | 99.6 /100 | #41 | Exceptional 48.9% |
| Immigrants | Vietnam | 99.6 /100 | #42 | Exceptional 48.8% |
| Immigrants | Iran | 99.6 /100 | #43 | Exceptional 48.8% |
| Welsh | 99.5 /100 | #44 | Exceptional 48.8% |
| Immigrants | Eastern Asia | 99.5 /100 | #45 | Exceptional 48.8% |
| Tsimshian | 99.5 /100 | #46 | Exceptional 48.7% |