Nepalese vs Haitian Married-couple Households
COMPARE
Nepalese
Haitian
Married-couple Households
Married-couple Households Comparison
Nepalese
Haitians
45.6%
MARRIED-COUPLE HOUSEHOLDS
11.9/ 100
METRIC RATING
205th/ 347
METRIC RANK
41.2%
MARRIED-COUPLE HOUSEHOLDS
0.0/ 100
METRIC RATING
310th/ 347
METRIC RANK
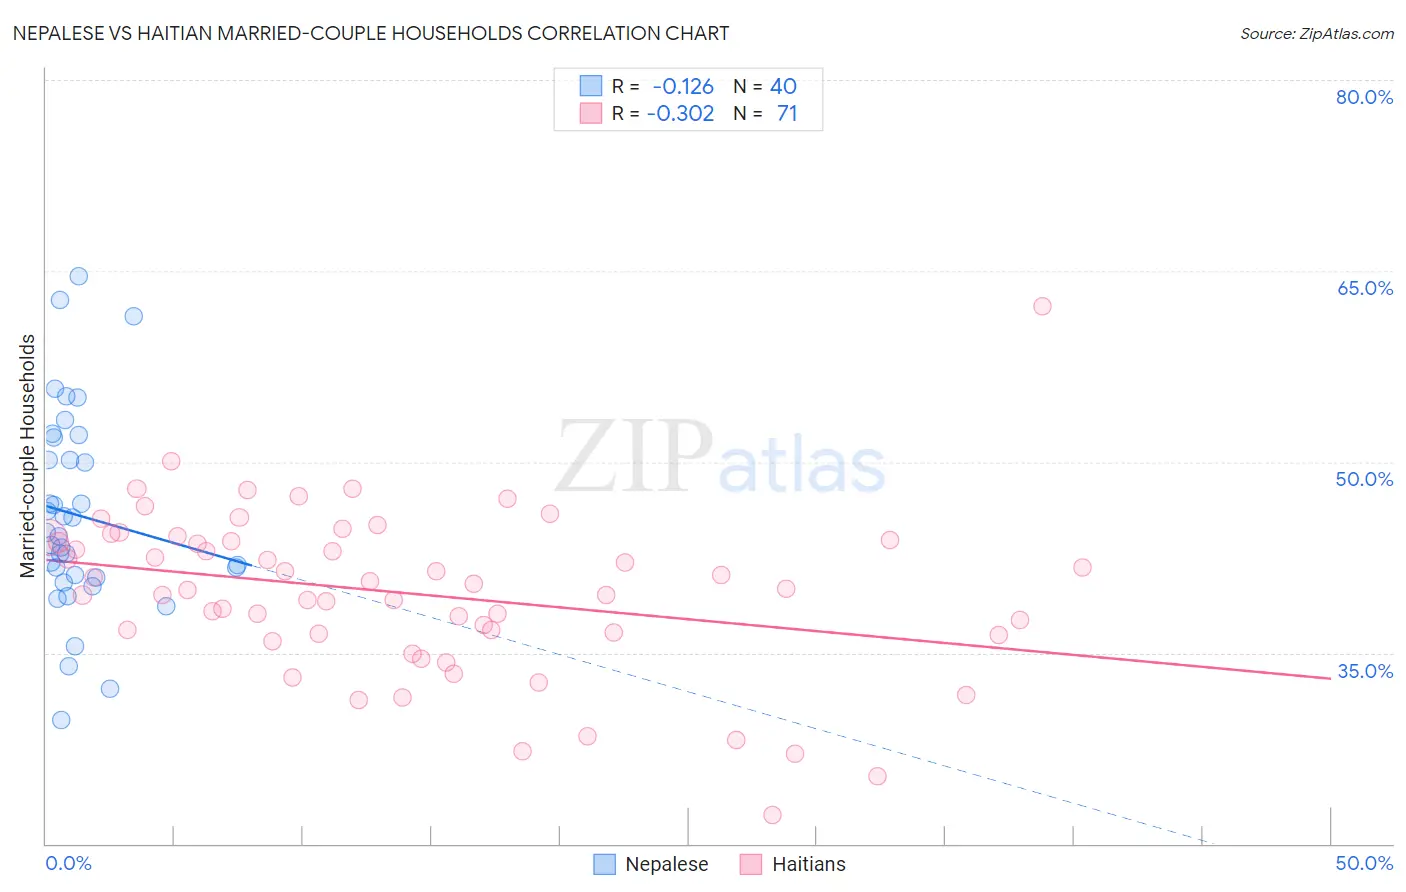
Nepalese vs Haitian Married-couple Households Correlation Chart
The statistical analysis conducted on geographies consisting of 24,521,755 people shows a poor negative correlation between the proportion of Nepalese and percentage of married-couple family households in the United States with a correlation coefficient (R) of -0.126 and weighted average of 45.6%. Similarly, the statistical analysis conducted on geographies consisting of 287,684,168 people shows a mild negative correlation between the proportion of Haitians and percentage of married-couple family households in the United States with a correlation coefficient (R) of -0.302 and weighted average of 41.2%, a difference of 10.7%.
Married-couple Households Correlation Summary
| Measurement | Nepalese | Haitian |
| Minimum | 29.7% | 22.3% |
| Maximum | 64.6% | 62.2% |
| Range | 34.9% | 40.0% |
| Mean | 45.8% | 39.7% |
| Median | 44.3% | 40.1% |
| Interquartile 25% (IQ1) | 41.0% | 36.5% |
| Interquartile 75% (IQ3) | 51.0% | 43.9% |
| Interquartile Range (IQR) | 10.0% | 7.4% |
| Standard Deviation (Sample) | 7.9% | 6.5% |
| Standard Deviation (Population) | 7.8% | 6.4% |
Similar Demographics by Married-couple Households
Demographics Similar to Nepalese by Married-couple Households
In terms of married-couple households, the demographic groups most similar to Nepalese are Aleut (45.6%, a difference of 0.050%), Alaska Native (45.6%, a difference of 0.10%), Uruguayan (45.5%, a difference of 0.14%), Immigrants from Central America (45.7%, a difference of 0.19%), and Immigrants from Serbia (45.7%, a difference of 0.27%).
| Demographics | Rating | Rank | Married-couple Households |
| Ottawa | 19.4 /100 | #198 | Poor 45.8% |
| Carpatho Rusyns | 15.7 /100 | #199 | Poor 45.7% |
| Potawatomi | 15.6 /100 | #200 | Poor 45.7% |
| Immigrants | Serbia | 15.2 /100 | #201 | Poor 45.7% |
| Immigrants | Central America | 14.2 /100 | #202 | Poor 45.7% |
| Alaska Natives | 13.0 /100 | #203 | Poor 45.6% |
| Aleuts | 12.5 /100 | #204 | Poor 45.6% |
| Nepalese | 11.9 /100 | #205 | Poor 45.6% |
| Uruguayans | 10.4 /100 | #206 | Poor 45.5% |
| Immigrants | France | 8.8 /100 | #207 | Tragic 45.4% |
| Hispanics or Latinos | 8.7 /100 | #208 | Tragic 45.4% |
| Immigrants | Uzbekistan | 8.4 /100 | #209 | Tragic 45.4% |
| Cubans | 7.7 /100 | #210 | Tragic 45.4% |
| Immigrants | Spain | 7.3 /100 | #211 | Tragic 45.3% |
| Creek | 6.4 /100 | #212 | Tragic 45.3% |
Demographics Similar to Haitians by Married-couple Households
In terms of married-couple households, the demographic groups most similar to Haitians are Immigrants from Trinidad and Tobago (41.2%, a difference of 0.070%), Crow (41.4%, a difference of 0.42%), Immigrants from Western Africa (41.4%, a difference of 0.43%), Guyanese (41.4%, a difference of 0.44%), and Colville (41.0%, a difference of 0.50%).
| Demographics | Rating | Rank | Married-couple Households |
| Sub-Saharan Africans | 0.0 /100 | #303 | Tragic 41.6% |
| Immigrants | Guyana | 0.0 /100 | #304 | Tragic 41.6% |
| Sioux | 0.0 /100 | #305 | Tragic 41.5% |
| Guyanese | 0.0 /100 | #306 | Tragic 41.4% |
| Immigrants | Western Africa | 0.0 /100 | #307 | Tragic 41.4% |
| Crow | 0.0 /100 | #308 | Tragic 41.4% |
| Immigrants | Trinidad and Tobago | 0.0 /100 | #309 | Tragic 41.2% |
| Haitians | 0.0 /100 | #310 | Tragic 41.2% |
| Colville | 0.0 /100 | #311 | Tragic 41.0% |
| Africans | 0.0 /100 | #312 | Tragic 40.9% |
| Immigrants | Haiti | 0.0 /100 | #313 | Tragic 40.9% |
| Jamaicans | 0.0 /100 | #314 | Tragic 40.9% |
| Trinidadians and Tobagonians | 0.0 /100 | #315 | Tragic 40.9% |
| Immigrants | Caribbean | 0.0 /100 | #316 | Tragic 40.8% |
| Immigrants | Jamaica | 0.0 /100 | #317 | Tragic 40.7% |