Laotian vs Immigrants from Norway Family Households
COMPARE
Laotian
Immigrants from Norway
Family Households
Family Households Comparison
Laotians
Immigrants from Norway
65.8%
FAMILY HOUSEHOLDS
99.9/ 100
METRIC RATING
73rd/ 347
METRIC RANK
62.1%
FAMILY HOUSEHOLDS
0.0/ 100
METRIC RATING
307th/ 347
METRIC RANK
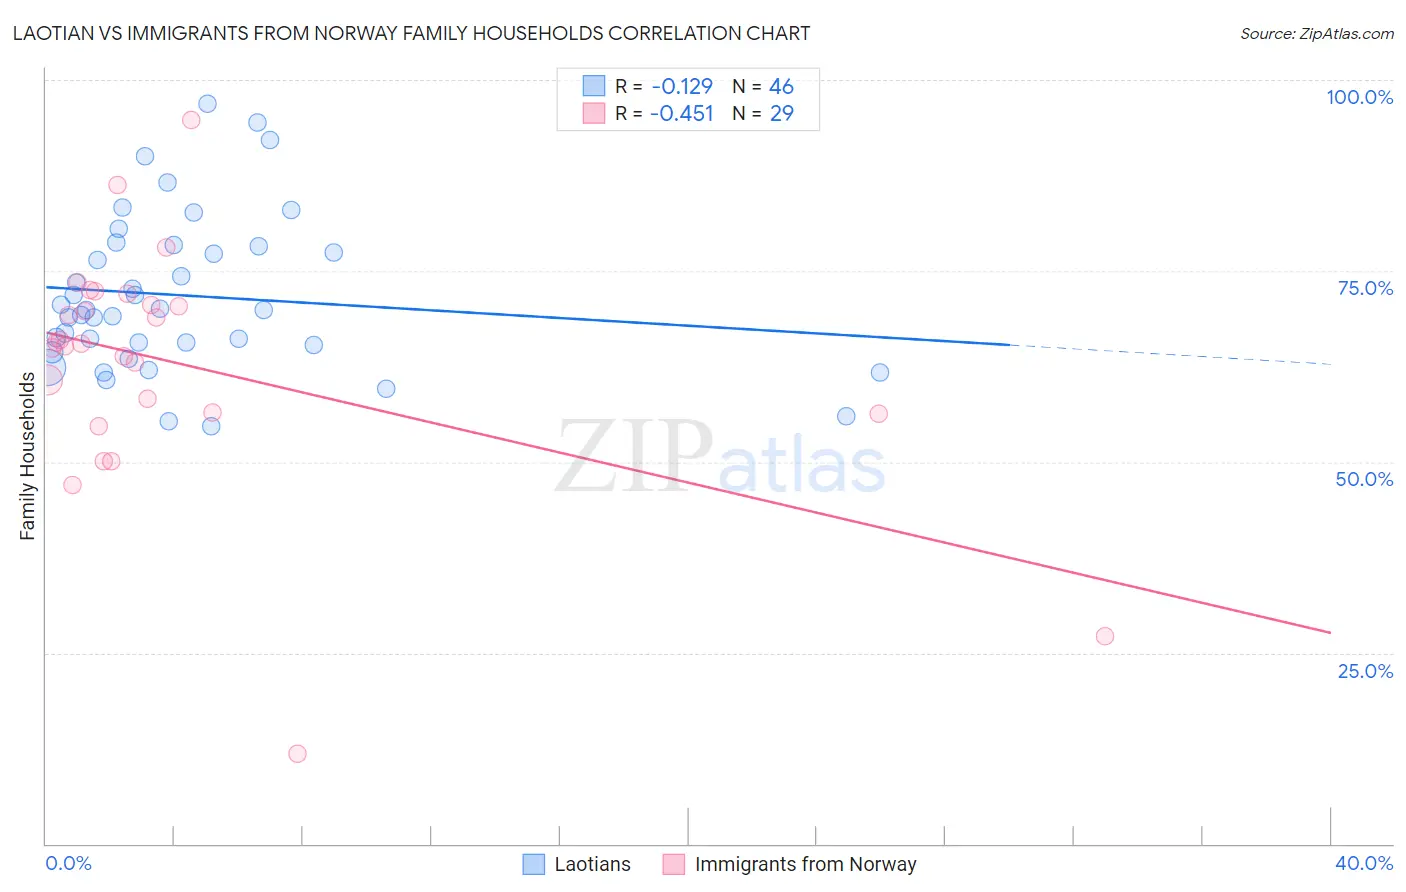
Laotian vs Immigrants from Norway Family Households Correlation Chart
The statistical analysis conducted on geographies consisting of 224,743,344 people shows a poor negative correlation between the proportion of Laotians and percentage of family households in the United States with a correlation coefficient (R) of -0.129 and weighted average of 65.8%. Similarly, the statistical analysis conducted on geographies consisting of 116,686,104 people shows a moderate negative correlation between the proportion of Immigrants from Norway and percentage of family households in the United States with a correlation coefficient (R) of -0.451 and weighted average of 62.1%, a difference of 5.9%.
Family Households Correlation Summary
| Measurement | Laotian | Immigrants from Norway |
| Minimum | 54.7% | 11.8% |
| Maximum | 96.9% | 94.8% |
| Range | 42.1% | 83.1% |
| Mean | 71.8% | 62.9% |
| Median | 69.9% | 65.4% |
| Interquartile 25% (IQ1) | 65.4% | 56.4% |
| Interquartile 75% (IQ3) | 78.3% | 71.3% |
| Interquartile Range (IQR) | 12.9% | 14.9% |
| Standard Deviation (Sample) | 10.2% | 15.9% |
| Standard Deviation (Population) | 10.1% | 15.6% |
Similar Demographics by Family Households
Demographics Similar to Laotians by Family Households
In terms of family households, the demographic groups most similar to Laotians are Burmese (65.7%, a difference of 0.040%), Portuguese (65.8%, a difference of 0.080%), Houma (65.7%, a difference of 0.090%), Bhutanese (65.9%, a difference of 0.13%), and Malaysian (65.9%, a difference of 0.15%).
| Demographics | Rating | Rank | Family Households |
| Fijians | 99.9 /100 | #66 | Exceptional 65.9% |
| Filipinos | 99.9 /100 | #67 | Exceptional 65.9% |
| Japanese | 99.9 /100 | #68 | Exceptional 65.9% |
| Malaysians | 99.9 /100 | #69 | Exceptional 65.9% |
| Immigrants | Afghanistan | 99.9 /100 | #70 | Exceptional 65.9% |
| Bhutanese | 99.9 /100 | #71 | Exceptional 65.9% |
| Portuguese | 99.9 /100 | #72 | Exceptional 65.8% |
| Laotians | 99.9 /100 | #73 | Exceptional 65.8% |
| Burmese | 99.9 /100 | #74 | Exceptional 65.7% |
| Houma | 99.9 /100 | #75 | Exceptional 65.7% |
| Immigrants | Azores | 99.8 /100 | #76 | Exceptional 65.6% |
| Immigrants | South America | 99.8 /100 | #77 | Exceptional 65.6% |
| Yaqui | 99.8 /100 | #78 | Exceptional 65.6% |
| Immigrants | Costa Rica | 99.8 /100 | #79 | Exceptional 65.6% |
| Puget Sound Salish | 99.8 /100 | #80 | Exceptional 65.6% |
Demographics Similar to Immigrants from Norway by Family Households
In terms of family households, the demographic groups most similar to Immigrants from Norway are Chippewa (62.1%, a difference of 0.0%), Subsaharan African (62.1%, a difference of 0.050%), African (62.1%, a difference of 0.080%), Bermudan (62.2%, a difference of 0.10%), and Immigrants from Liberia (62.0%, a difference of 0.10%).
| Demographics | Rating | Rank | Family Households |
| Immigrants | Africa | 0.0 /100 | #300 | Tragic 62.4% |
| Immigrants | Albania | 0.0 /100 | #301 | Tragic 62.4% |
| Immigrants | Kenya | 0.0 /100 | #302 | Tragic 62.3% |
| Cree | 0.0 /100 | #303 | Tragic 62.3% |
| Iroquois | 0.0 /100 | #304 | Tragic 62.2% |
| Bermudans | 0.0 /100 | #305 | Tragic 62.2% |
| Africans | 0.0 /100 | #306 | Tragic 62.1% |
| Immigrants | Norway | 0.0 /100 | #307 | Tragic 62.1% |
| Chippewa | 0.0 /100 | #308 | Tragic 62.1% |
| Sub-Saharan Africans | 0.0 /100 | #309 | Tragic 62.1% |
| Immigrants | Liberia | 0.0 /100 | #310 | Tragic 62.0% |
| Immigrants | Morocco | 0.0 /100 | #311 | Tragic 62.0% |
| Immigrants | Latvia | 0.0 /100 | #312 | Tragic 62.0% |
| Liberians | 0.0 /100 | #313 | Tragic 62.0% |
| Immigrants | Cabo Verde | 0.0 /100 | #314 | Tragic 61.9% |