Laotian vs Immigrants from Iraq Family Households
COMPARE
Laotian
Immigrants from Iraq
Family Households
Family Households Comparison
Laotians
Immigrants from Iraq
65.8%
FAMILY HOUSEHOLDS
99.9/ 100
METRIC RATING
73rd/ 347
METRIC RANK
65.0%
FAMILY HOUSEHOLDS
95.4/ 100
METRIC RATING
116th/ 347
METRIC RANK
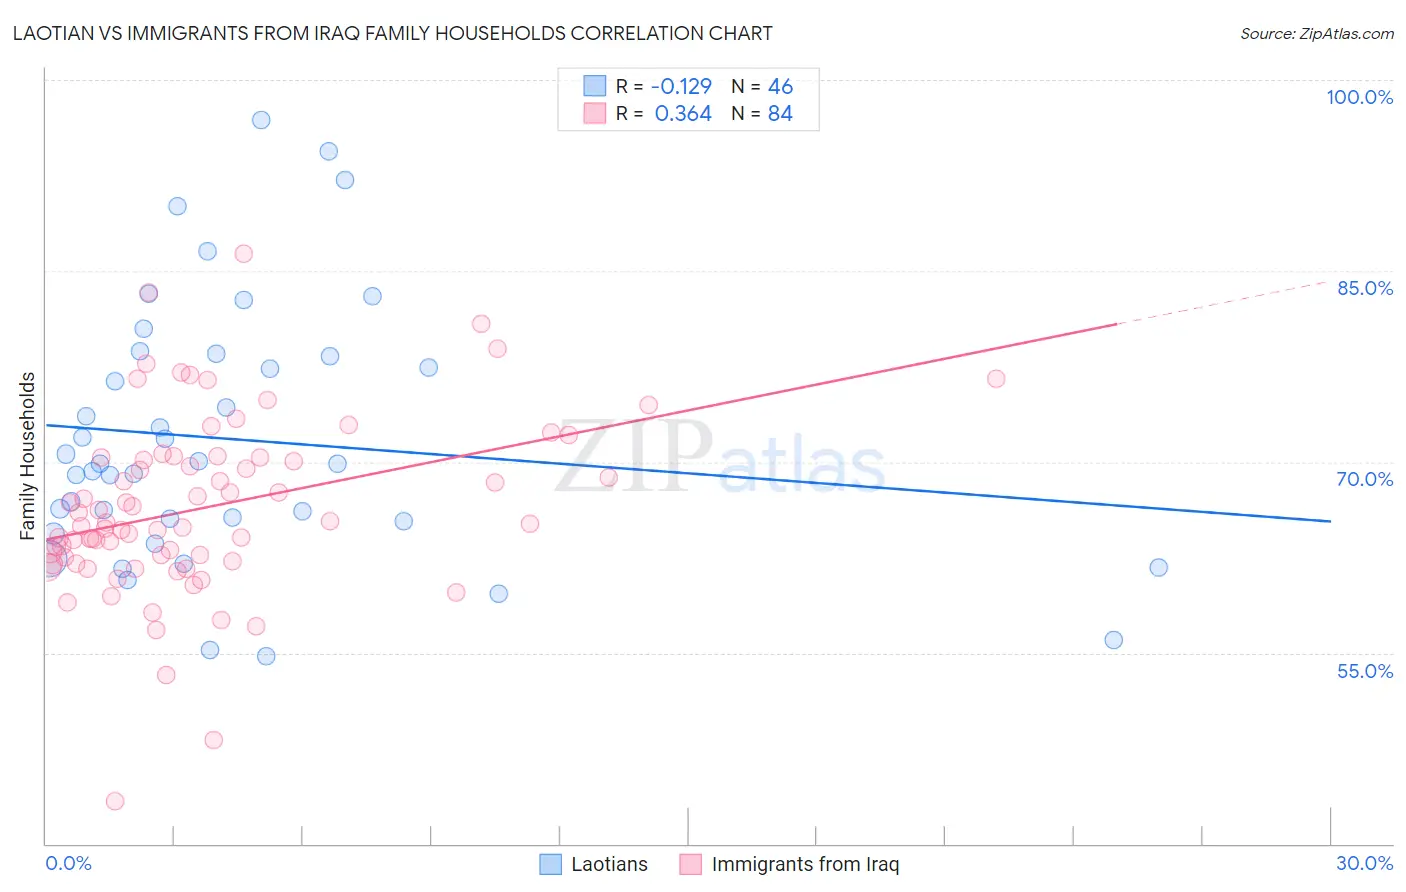
Laotian vs Immigrants from Iraq Family Households Correlation Chart
The statistical analysis conducted on geographies consisting of 224,743,344 people shows a poor negative correlation between the proportion of Laotians and percentage of family households in the United States with a correlation coefficient (R) of -0.129 and weighted average of 65.8%. Similarly, the statistical analysis conducted on geographies consisting of 194,748,040 people shows a mild positive correlation between the proportion of Immigrants from Iraq and percentage of family households in the United States with a correlation coefficient (R) of 0.364 and weighted average of 65.0%, a difference of 1.3%.
Family Households Correlation Summary
| Measurement | Laotian | Immigrants from Iraq |
| Minimum | 54.7% | 43.4% |
| Maximum | 96.9% | 86.3% |
| Range | 42.1% | 43.0% |
| Mean | 71.8% | 66.4% |
| Median | 69.9% | 65.2% |
| Interquartile 25% (IQ1) | 65.4% | 62.3% |
| Interquartile 75% (IQ3) | 78.3% | 70.4% |
| Interquartile Range (IQR) | 12.9% | 8.0% |
| Standard Deviation (Sample) | 10.2% | 7.1% |
| Standard Deviation (Population) | 10.1% | 7.0% |
Similar Demographics by Family Households
Demographics Similar to Laotians by Family Households
In terms of family households, the demographic groups most similar to Laotians are Burmese (65.7%, a difference of 0.040%), Portuguese (65.8%, a difference of 0.080%), Houma (65.7%, a difference of 0.090%), Bhutanese (65.9%, a difference of 0.13%), and Malaysian (65.9%, a difference of 0.15%).
| Demographics | Rating | Rank | Family Households |
| Fijians | 99.9 /100 | #66 | Exceptional 65.9% |
| Filipinos | 99.9 /100 | #67 | Exceptional 65.9% |
| Japanese | 99.9 /100 | #68 | Exceptional 65.9% |
| Malaysians | 99.9 /100 | #69 | Exceptional 65.9% |
| Immigrants | Afghanistan | 99.9 /100 | #70 | Exceptional 65.9% |
| Bhutanese | 99.9 /100 | #71 | Exceptional 65.9% |
| Portuguese | 99.9 /100 | #72 | Exceptional 65.8% |
| Laotians | 99.9 /100 | #73 | Exceptional 65.8% |
| Burmese | 99.9 /100 | #74 | Exceptional 65.7% |
| Houma | 99.9 /100 | #75 | Exceptional 65.7% |
| Immigrants | Azores | 99.8 /100 | #76 | Exceptional 65.6% |
| Immigrants | South America | 99.8 /100 | #77 | Exceptional 65.6% |
| Yaqui | 99.8 /100 | #78 | Exceptional 65.6% |
| Immigrants | Costa Rica | 99.8 /100 | #79 | Exceptional 65.6% |
| Puget Sound Salish | 99.8 /100 | #80 | Exceptional 65.6% |
Demographics Similar to Immigrants from Iraq by Family Households
In terms of family households, the demographic groups most similar to Immigrants from Iraq are Ecuadorian (65.0%, a difference of 0.0%), Cherokee (65.0%, a difference of 0.0%), Dutch (64.9%, a difference of 0.020%), Argentinean (65.0%, a difference of 0.030%), and Spanish (65.0%, a difference of 0.070%).
| Demographics | Rating | Rank | Family Households |
| Immigrants | Guatemala | 96.9 /100 | #109 | Exceptional 65.0% |
| Scandinavians | 96.8 /100 | #110 | Exceptional 65.0% |
| Europeans | 96.8 /100 | #111 | Exceptional 65.0% |
| Immigrants | Jordan | 96.5 /100 | #112 | Exceptional 65.0% |
| Spanish | 96.2 /100 | #113 | Exceptional 65.0% |
| Argentineans | 95.7 /100 | #114 | Exceptional 65.0% |
| Ecuadorians | 95.4 /100 | #115 | Exceptional 65.0% |
| Immigrants | Iraq | 95.4 /100 | #116 | Exceptional 65.0% |
| Cherokee | 95.3 /100 | #117 | Exceptional 65.0% |
| Dutch | 95.1 /100 | #118 | Exceptional 64.9% |
| Immigrants | Eastern Asia | 94.4 /100 | #119 | Exceptional 64.9% |
| Immigrants | Oceania | 94.2 /100 | #120 | Exceptional 64.9% |
| Hungarians | 94.0 /100 | #121 | Exceptional 64.9% |
| Hmong | 93.4 /100 | #122 | Exceptional 64.9% |
| Choctaw | 93.4 /100 | #123 | Exceptional 64.9% |