Swedish vs Immigrants from Norway Family Households
COMPARE
Swedish
Immigrants from Norway
Family Households
Family Households Comparison
Swedes
Immigrants from Norway
64.5%
FAMILY HOUSEHOLDS
69.8/ 100
METRIC RATING
153rd/ 347
METRIC RANK
62.1%
FAMILY HOUSEHOLDS
0.0/ 100
METRIC RATING
307th/ 347
METRIC RANK
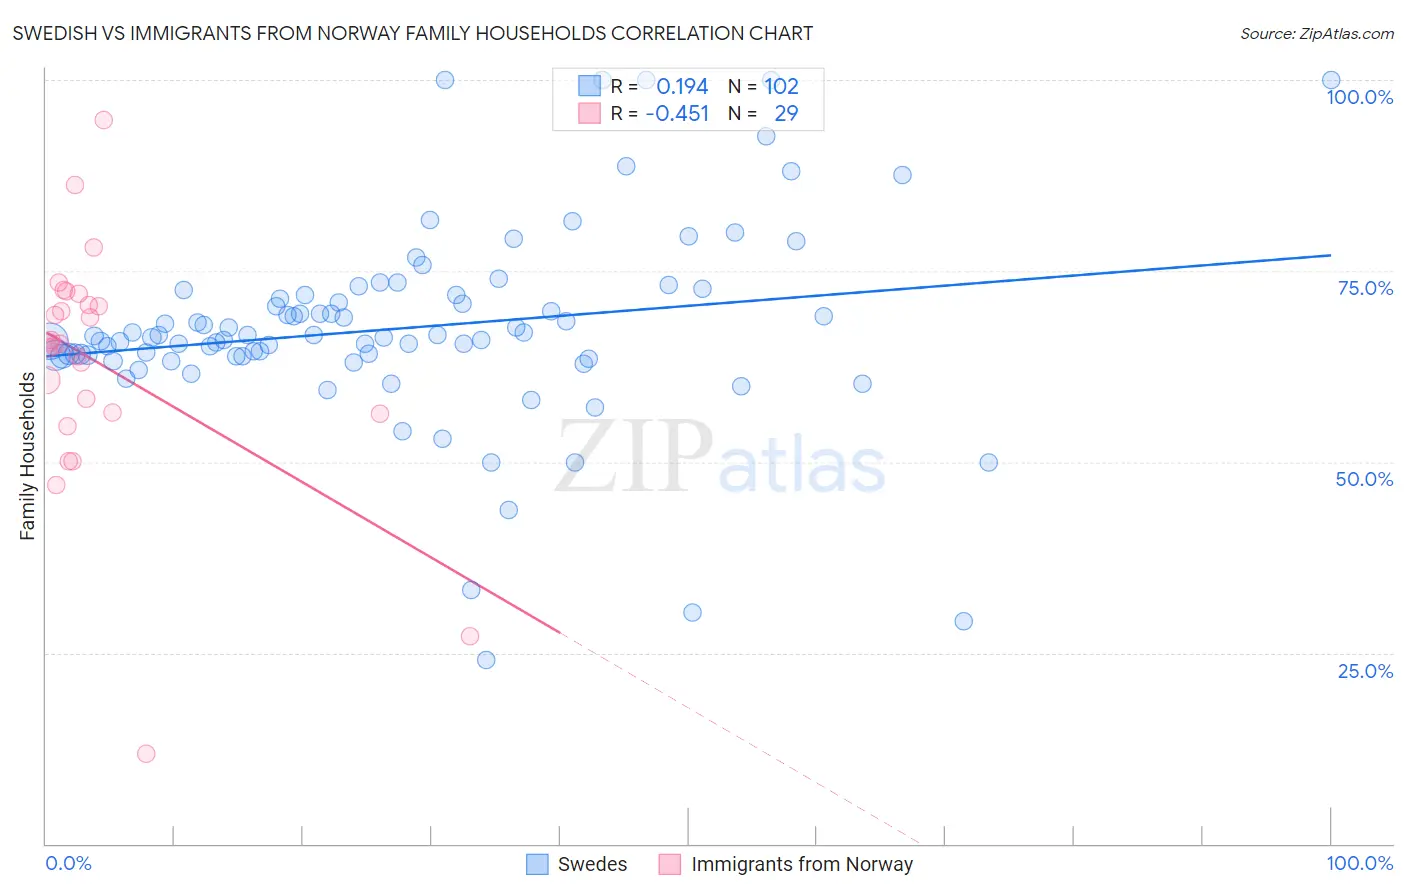
Swedish vs Immigrants from Norway Family Households Correlation Chart
The statistical analysis conducted on geographies consisting of 538,762,235 people shows a poor positive correlation between the proportion of Swedes and percentage of family households in the United States with a correlation coefficient (R) of 0.194 and weighted average of 64.5%. Similarly, the statistical analysis conducted on geographies consisting of 116,686,104 people shows a moderate negative correlation between the proportion of Immigrants from Norway and percentage of family households in the United States with a correlation coefficient (R) of -0.451 and weighted average of 62.1%, a difference of 3.9%.
Family Households Correlation Summary
| Measurement | Swedish | Immigrants from Norway |
| Minimum | 24.0% | 11.8% |
| Maximum | 100.0% | 94.8% |
| Range | 76.0% | 83.1% |
| Mean | 67.5% | 62.9% |
| Median | 66.4% | 65.4% |
| Interquartile 25% (IQ1) | 63.8% | 56.4% |
| Interquartile 75% (IQ3) | 71.8% | 71.3% |
| Interquartile Range (IQR) | 8.0% | 14.9% |
| Standard Deviation (Sample) | 13.1% | 15.9% |
| Standard Deviation (Population) | 13.0% | 15.6% |
Similar Demographics by Family Households
Demographics Similar to Swedes by Family Households
In terms of family households, the demographic groups most similar to Swedes are Scottish (64.5%, a difference of 0.020%), Austrian (64.5%, a difference of 0.020%), Uruguayan (64.5%, a difference of 0.030%), Czech (64.5%, a difference of 0.040%), and Canadian (64.4%, a difference of 0.050%).
| Demographics | Rating | Rank | Family Households |
| Immigrants | Romania | 77.0 /100 | #146 | Good 64.6% |
| Immigrants | Chile | 76.5 /100 | #147 | Good 64.6% |
| Delaware | 76.3 /100 | #148 | Good 64.6% |
| Sioux | 76.3 /100 | #149 | Good 64.6% |
| Romanians | 75.3 /100 | #150 | Good 64.5% |
| Syrians | 75.2 /100 | #151 | Good 64.5% |
| Scottish | 70.9 /100 | #152 | Good 64.5% |
| Swedes | 69.8 /100 | #153 | Good 64.5% |
| Austrians | 68.5 /100 | #154 | Good 64.5% |
| Uruguayans | 67.7 /100 | #155 | Good 64.5% |
| Czechs | 67.0 /100 | #156 | Good 64.5% |
| Canadians | 66.6 /100 | #157 | Good 64.4% |
| Lebanese | 66.4 /100 | #158 | Good 64.4% |
| Germans | 65.8 /100 | #159 | Good 64.4% |
| Immigrants | Moldova | 65.2 /100 | #160 | Good 64.4% |
Demographics Similar to Immigrants from Norway by Family Households
In terms of family households, the demographic groups most similar to Immigrants from Norway are Chippewa (62.1%, a difference of 0.0%), Subsaharan African (62.1%, a difference of 0.050%), African (62.1%, a difference of 0.080%), Bermudan (62.2%, a difference of 0.10%), and Immigrants from Liberia (62.0%, a difference of 0.10%).
| Demographics | Rating | Rank | Family Households |
| Immigrants | Africa | 0.0 /100 | #300 | Tragic 62.4% |
| Immigrants | Albania | 0.0 /100 | #301 | Tragic 62.4% |
| Immigrants | Kenya | 0.0 /100 | #302 | Tragic 62.3% |
| Cree | 0.0 /100 | #303 | Tragic 62.3% |
| Iroquois | 0.0 /100 | #304 | Tragic 62.2% |
| Bermudans | 0.0 /100 | #305 | Tragic 62.2% |
| Africans | 0.0 /100 | #306 | Tragic 62.1% |
| Immigrants | Norway | 0.0 /100 | #307 | Tragic 62.1% |
| Chippewa | 0.0 /100 | #308 | Tragic 62.1% |
| Sub-Saharan Africans | 0.0 /100 | #309 | Tragic 62.1% |
| Immigrants | Liberia | 0.0 /100 | #310 | Tragic 62.0% |
| Immigrants | Morocco | 0.0 /100 | #311 | Tragic 62.0% |
| Immigrants | Latvia | 0.0 /100 | #312 | Tragic 62.0% |
| Liberians | 0.0 /100 | #313 | Tragic 62.0% |
| Immigrants | Cabo Verde | 0.0 /100 | #314 | Tragic 61.9% |