Laotian vs Immigrants from Norway 5th Grade
COMPARE
Laotian
Immigrants from Norway
5th Grade
5th Grade Comparison
Laotians
Immigrants from Norway
97.1%
5TH GRADE
10.8/ 100
METRIC RATING
208th/ 347
METRIC RANK
97.6%
5TH GRADE
94.6/ 100
METRIC RATING
123rd/ 347
METRIC RANK
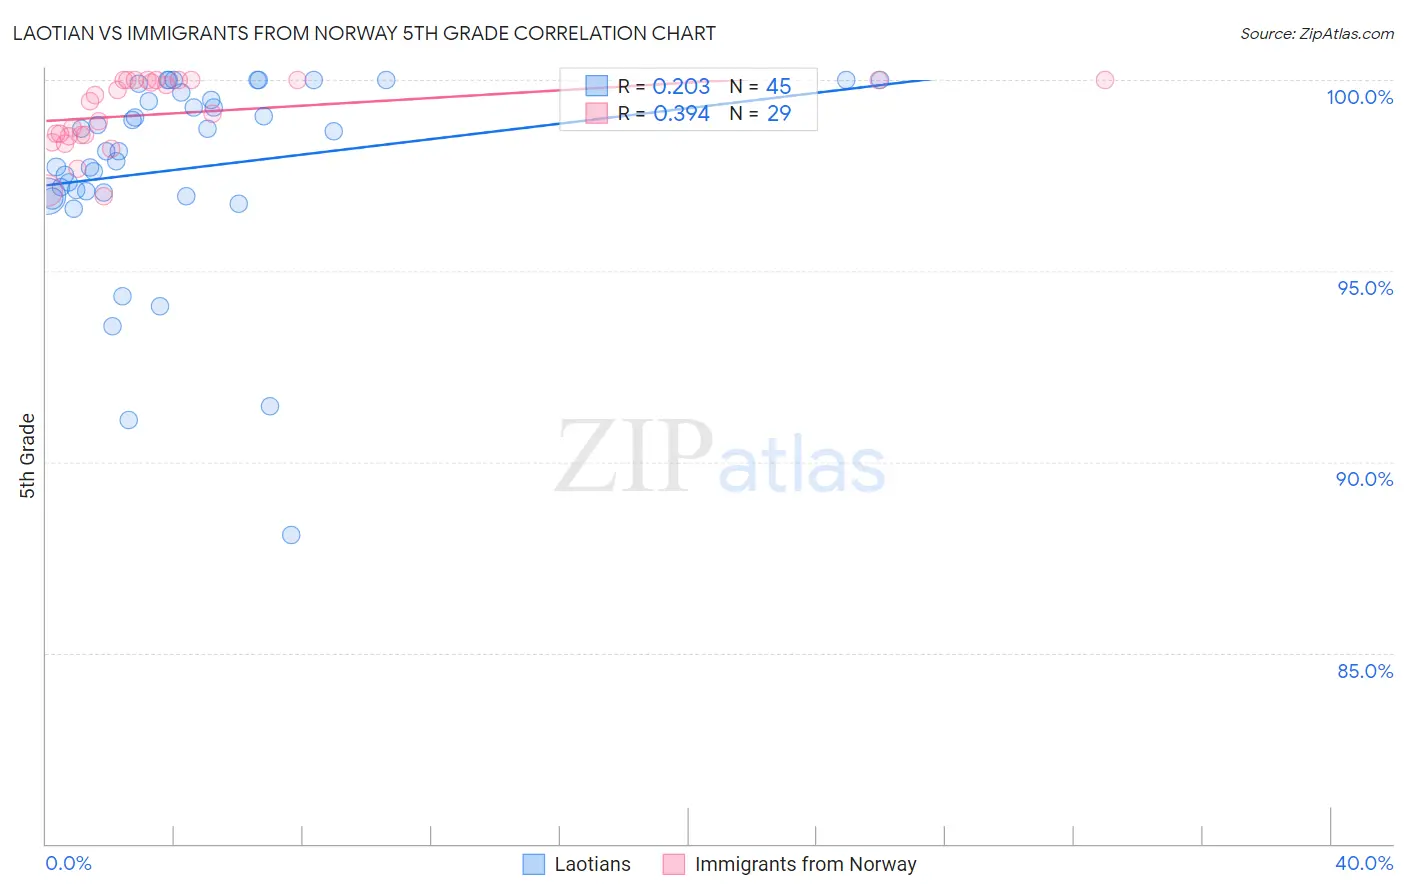
Laotian vs Immigrants from Norway 5th Grade Correlation Chart
The statistical analysis conducted on geographies consisting of 224,856,886 people shows a weak positive correlation between the proportion of Laotians and percentage of population with at least 5th grade education in the United States with a correlation coefficient (R) of 0.203 and weighted average of 97.1%. Similarly, the statistical analysis conducted on geographies consisting of 116,716,420 people shows a mild positive correlation between the proportion of Immigrants from Norway and percentage of population with at least 5th grade education in the United States with a correlation coefficient (R) of 0.394 and weighted average of 97.6%, a difference of 0.52%.
5th Grade Correlation Summary
| Measurement | Laotian | Immigrants from Norway |
| Minimum | 88.1% | 97.0% |
| Maximum | 100.0% | 100.0% |
| Range | 11.9% | 3.0% |
| Mean | 97.7% | 99.1% |
| Median | 98.1% | 99.4% |
| Interquartile 25% (IQ1) | 97.0% | 98.5% |
| Interquartile 75% (IQ3) | 99.6% | 100.0% |
| Interquartile Range (IQR) | 2.6% | 1.5% |
| Standard Deviation (Sample) | 2.6% | 0.93% |
| Standard Deviation (Population) | 2.6% | 0.91% |
Similar Demographics by 5th Grade
Demographics Similar to Laotians by 5th Grade
In terms of 5th grade, the demographic groups most similar to Laotians are Iraqi (97.1%, a difference of 0.0%), Moroccan (97.1%, a difference of 0.010%), Paiute (97.1%, a difference of 0.010%), Immigrants from Nepal (97.1%, a difference of 0.010%), and Immigrants from Oceania (97.1%, a difference of 0.010%).
| Demographics | Rating | Rank | 5th Grade |
| Immigrants | Chile | 16.6 /100 | #201 | Poor 97.2% |
| Africans | 15.3 /100 | #202 | Poor 97.2% |
| Immigrants | Bahamas | 14.9 /100 | #203 | Poor 97.2% |
| Immigrants | Zaire | 13.7 /100 | #204 | Poor 97.1% |
| Moroccans | 12.0 /100 | #205 | Poor 97.1% |
| Paiute | 11.6 /100 | #206 | Poor 97.1% |
| Iraqis | 10.9 /100 | #207 | Poor 97.1% |
| Laotians | 10.8 /100 | #208 | Poor 97.1% |
| Immigrants | Nepal | 10.3 /100 | #209 | Poor 97.1% |
| Immigrants | Oceania | 10.0 /100 | #210 | Poor 97.1% |
| Samoans | 8.5 /100 | #211 | Tragic 97.1% |
| Immigrants | Iraq | 8.3 /100 | #212 | Tragic 97.1% |
| Portuguese | 7.8 /100 | #213 | Tragic 97.1% |
| Costa Ricans | 7.7 /100 | #214 | Tragic 97.1% |
| Immigrants | Morocco | 7.5 /100 | #215 | Tragic 97.1% |
Demographics Similar to Immigrants from Norway by 5th Grade
In terms of 5th grade, the demographic groups most similar to Immigrants from Norway are Immigrants from France (97.6%, a difference of 0.0%), Immigrants from Japan (97.6%, a difference of 0.0%), Basque (97.6%, a difference of 0.010%), Syrian (97.6%, a difference of 0.010%), and Immigrants from Zimbabwe (97.6%, a difference of 0.010%).
| Demographics | Rating | Rank | 5th Grade |
| Immigrants | Croatia | 95.5 /100 | #116 | Exceptional 97.6% |
| Immigrants | Saudi Arabia | 95.4 /100 | #117 | Exceptional 97.6% |
| Basques | 95.2 /100 | #118 | Exceptional 97.6% |
| Syrians | 95.1 /100 | #119 | Exceptional 97.6% |
| Immigrants | Zimbabwe | 94.9 /100 | #120 | Exceptional 97.6% |
| Immigrants | France | 94.8 /100 | #121 | Exceptional 97.6% |
| Immigrants | Japan | 94.7 /100 | #122 | Exceptional 97.6% |
| Immigrants | Norway | 94.6 /100 | #123 | Exceptional 97.6% |
| Spanish | 93.7 /100 | #124 | Exceptional 97.6% |
| Immigrants | Bulgaria | 93.1 /100 | #125 | Exceptional 97.6% |
| Hmong | 92.3 /100 | #126 | Exceptional 97.6% |
| Immigrants | Serbia | 92.3 /100 | #127 | Exceptional 97.6% |
| Colville | 92.0 /100 | #128 | Exceptional 97.6% |
| Immigrants | Europe | 91.9 /100 | #129 | Exceptional 97.6% |
| Immigrants | Romania | 91.6 /100 | #130 | Exceptional 97.6% |