Tongan vs Immigrants from Iraq Family Households
COMPARE
Tongan
Immigrants from Iraq
Family Households
Family Households Comparison
Tongans
Immigrants from Iraq
69.6%
FAMILY HOUSEHOLDS
100.0/ 100
METRIC RATING
3rd/ 347
METRIC RANK
65.0%
FAMILY HOUSEHOLDS
95.4/ 100
METRIC RATING
116th/ 347
METRIC RANK
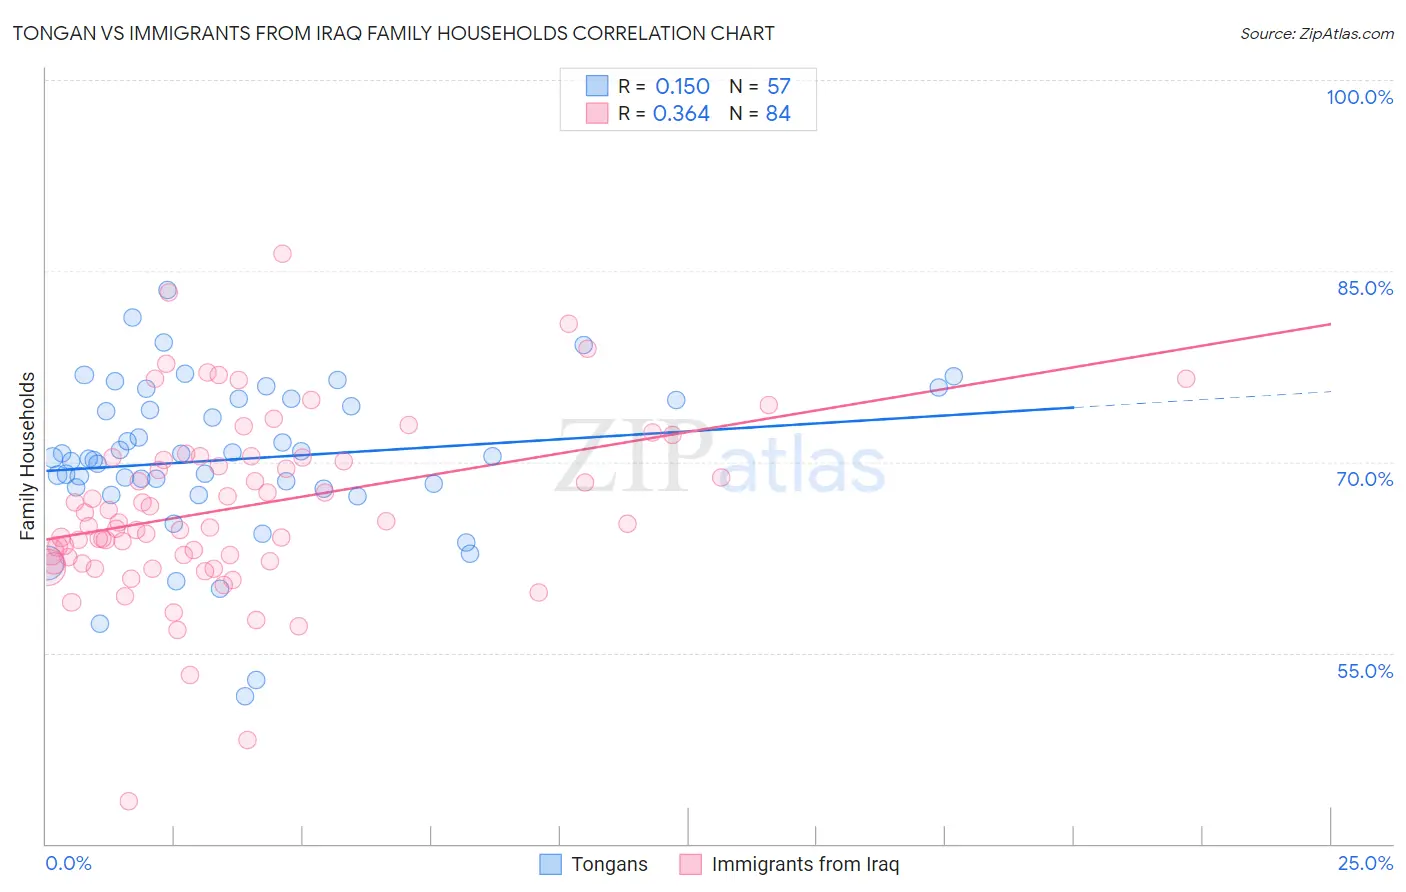
Tongan vs Immigrants from Iraq Family Households Correlation Chart
The statistical analysis conducted on geographies consisting of 102,870,916 people shows a poor positive correlation between the proportion of Tongans and percentage of family households in the United States with a correlation coefficient (R) of 0.150 and weighted average of 69.6%. Similarly, the statistical analysis conducted on geographies consisting of 194,748,040 people shows a mild positive correlation between the proportion of Immigrants from Iraq and percentage of family households in the United States with a correlation coefficient (R) of 0.364 and weighted average of 65.0%, a difference of 7.2%.
Family Households Correlation Summary
| Measurement | Tongan | Immigrants from Iraq |
| Minimum | 51.6% | 43.4% |
| Maximum | 83.5% | 86.3% |
| Range | 31.9% | 43.0% |
| Mean | 70.2% | 66.4% |
| Median | 70.4% | 65.2% |
| Interquartile 25% (IQ1) | 68.0% | 62.3% |
| Interquartile 75% (IQ3) | 74.9% | 70.4% |
| Interquartile Range (IQR) | 7.0% | 8.0% |
| Standard Deviation (Sample) | 6.3% | 7.1% |
| Standard Deviation (Population) | 6.2% | 7.0% |
Similar Demographics by Family Households
Demographics Similar to Tongans by Family Households
In terms of family households, the demographic groups most similar to Tongans are Yakama (69.3%, a difference of 0.44%), Yuman (69.3%, a difference of 0.47%), Immigrants from Mexico (69.1%, a difference of 0.71%), Mexican (69.0%, a difference of 0.92%), and Immigrants from Fiji (68.8%, a difference of 1.2%).
| Demographics | Rating | Rank | Family Households |
| Yup'ik | 100 /100 | #1 | Exceptional 72.4% |
| Spanish American Indians | 100.0 /100 | #2 | Exceptional 71.2% |
| Tongans | 100.0 /100 | #3 | Exceptional 69.6% |
| Yakama | 100.0 /100 | #4 | Exceptional 69.3% |
| Yuman | 100.0 /100 | #5 | Exceptional 69.3% |
| Immigrants | Mexico | 100.0 /100 | #6 | Exceptional 69.1% |
| Mexicans | 100.0 /100 | #7 | Exceptional 69.0% |
| Immigrants | Fiji | 100.0 /100 | #8 | Exceptional 68.8% |
| Native Hawaiians | 100.0 /100 | #9 | Exceptional 68.4% |
| Immigrants | Philippines | 100.0 /100 | #10 | Exceptional 68.3% |
| Immigrants | Central America | 100.0 /100 | #11 | Exceptional 68.3% |
| Koreans | 100.0 /100 | #12 | Exceptional 68.3% |
| Pueblo | 100.0 /100 | #13 | Exceptional 68.2% |
| Immigrants | Cuba | 100.0 /100 | #14 | Exceptional 68.2% |
| Assyrians/Chaldeans/Syriacs | 100.0 /100 | #15 | Exceptional 68.2% |
Demographics Similar to Immigrants from Iraq by Family Households
In terms of family households, the demographic groups most similar to Immigrants from Iraq are Ecuadorian (65.0%, a difference of 0.0%), Cherokee (65.0%, a difference of 0.0%), Dutch (64.9%, a difference of 0.020%), Argentinean (65.0%, a difference of 0.030%), and Spanish (65.0%, a difference of 0.070%).
| Demographics | Rating | Rank | Family Households |
| Immigrants | Guatemala | 96.9 /100 | #109 | Exceptional 65.0% |
| Scandinavians | 96.8 /100 | #110 | Exceptional 65.0% |
| Europeans | 96.8 /100 | #111 | Exceptional 65.0% |
| Immigrants | Jordan | 96.5 /100 | #112 | Exceptional 65.0% |
| Spanish | 96.2 /100 | #113 | Exceptional 65.0% |
| Argentineans | 95.7 /100 | #114 | Exceptional 65.0% |
| Ecuadorians | 95.4 /100 | #115 | Exceptional 65.0% |
| Immigrants | Iraq | 95.4 /100 | #116 | Exceptional 65.0% |
| Cherokee | 95.3 /100 | #117 | Exceptional 65.0% |
| Dutch | 95.1 /100 | #118 | Exceptional 64.9% |
| Immigrants | Eastern Asia | 94.4 /100 | #119 | Exceptional 64.9% |
| Immigrants | Oceania | 94.2 /100 | #120 | Exceptional 64.9% |
| Hungarians | 94.0 /100 | #121 | Exceptional 64.9% |
| Hmong | 93.4 /100 | #122 | Exceptional 64.9% |
| Choctaw | 93.4 /100 | #123 | Exceptional 64.9% |