Uruguayan vs Immigrants from Iraq Family Households
COMPARE
Uruguayan
Immigrants from Iraq
Family Households
Family Households Comparison
Uruguayans
Immigrants from Iraq
64.5%
FAMILY HOUSEHOLDS
67.7/ 100
METRIC RATING
155th/ 347
METRIC RANK
65.0%
FAMILY HOUSEHOLDS
95.4/ 100
METRIC RATING
116th/ 347
METRIC RANK
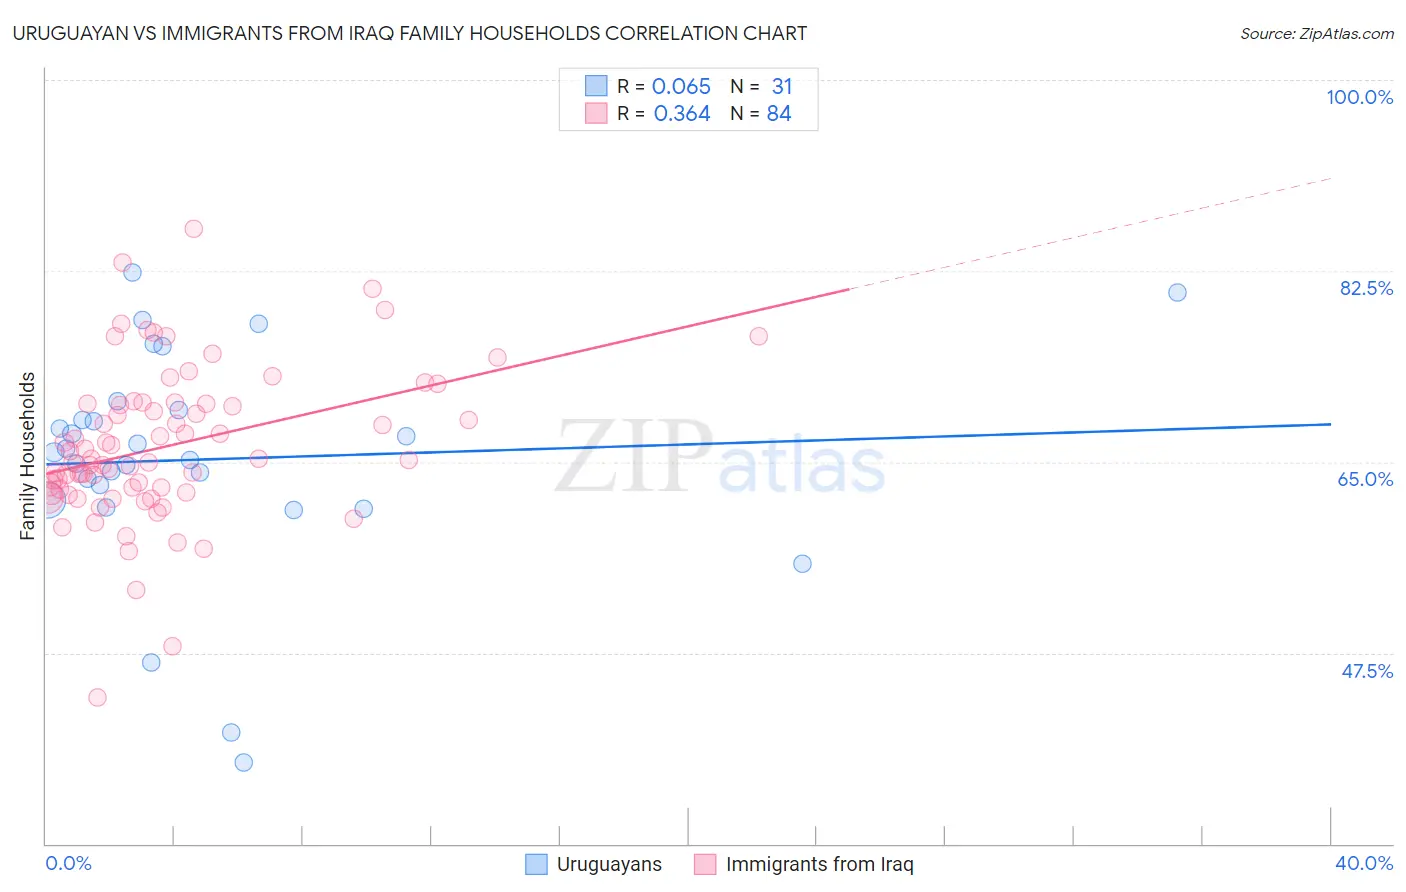
Uruguayan vs Immigrants from Iraq Family Households Correlation Chart
The statistical analysis conducted on geographies consisting of 144,759,449 people shows a slight positive correlation between the proportion of Uruguayans and percentage of family households in the United States with a correlation coefficient (R) of 0.065 and weighted average of 64.5%. Similarly, the statistical analysis conducted on geographies consisting of 194,748,040 people shows a mild positive correlation between the proportion of Immigrants from Iraq and percentage of family households in the United States with a correlation coefficient (R) of 0.364 and weighted average of 65.0%, a difference of 0.77%.
Family Households Correlation Summary
| Measurement | Uruguayan | Immigrants from Iraq |
| Minimum | 37.5% | 43.4% |
| Maximum | 82.3% | 86.3% |
| Range | 44.8% | 43.0% |
| Mean | 65.2% | 66.4% |
| Median | 65.8% | 65.2% |
| Interquartile 25% (IQ1) | 61.5% | 62.3% |
| Interquartile 75% (IQ3) | 69.7% | 70.4% |
| Interquartile Range (IQR) | 8.2% | 8.0% |
| Standard Deviation (Sample) | 10.1% | 7.1% |
| Standard Deviation (Population) | 10.0% | 7.0% |
Similar Demographics by Family Households
Demographics Similar to Uruguayans by Family Households
In terms of family households, the demographic groups most similar to Uruguayans are Austrian (64.5%, a difference of 0.010%), Czech (64.5%, a difference of 0.010%), Canadian (64.4%, a difference of 0.020%), Lebanese (64.4%, a difference of 0.020%), and Swedish (64.5%, a difference of 0.030%).
| Demographics | Rating | Rank | Family Households |
| Delaware | 76.3 /100 | #148 | Good 64.6% |
| Sioux | 76.3 /100 | #149 | Good 64.6% |
| Romanians | 75.3 /100 | #150 | Good 64.5% |
| Syrians | 75.2 /100 | #151 | Good 64.5% |
| Scottish | 70.9 /100 | #152 | Good 64.5% |
| Swedes | 69.8 /100 | #153 | Good 64.5% |
| Austrians | 68.5 /100 | #154 | Good 64.5% |
| Uruguayans | 67.7 /100 | #155 | Good 64.5% |
| Czechs | 67.0 /100 | #156 | Good 64.5% |
| Canadians | 66.6 /100 | #157 | Good 64.4% |
| Lebanese | 66.4 /100 | #158 | Good 64.4% |
| Germans | 65.8 /100 | #159 | Good 64.4% |
| Immigrants | Moldova | 65.2 /100 | #160 | Good 64.4% |
| Immigrants | England | 62.6 /100 | #161 | Good 64.4% |
| British | 61.6 /100 | #162 | Good 64.4% |
Demographics Similar to Immigrants from Iraq by Family Households
In terms of family households, the demographic groups most similar to Immigrants from Iraq are Ecuadorian (65.0%, a difference of 0.0%), Cherokee (65.0%, a difference of 0.0%), Dutch (64.9%, a difference of 0.020%), Argentinean (65.0%, a difference of 0.030%), and Spanish (65.0%, a difference of 0.070%).
| Demographics | Rating | Rank | Family Households |
| Immigrants | Guatemala | 96.9 /100 | #109 | Exceptional 65.0% |
| Scandinavians | 96.8 /100 | #110 | Exceptional 65.0% |
| Europeans | 96.8 /100 | #111 | Exceptional 65.0% |
| Immigrants | Jordan | 96.5 /100 | #112 | Exceptional 65.0% |
| Spanish | 96.2 /100 | #113 | Exceptional 65.0% |
| Argentineans | 95.7 /100 | #114 | Exceptional 65.0% |
| Ecuadorians | 95.4 /100 | #115 | Exceptional 65.0% |
| Immigrants | Iraq | 95.4 /100 | #116 | Exceptional 65.0% |
| Cherokee | 95.3 /100 | #117 | Exceptional 65.0% |
| Dutch | 95.1 /100 | #118 | Exceptional 64.9% |
| Immigrants | Eastern Asia | 94.4 /100 | #119 | Exceptional 64.9% |
| Immigrants | Oceania | 94.2 /100 | #120 | Exceptional 64.9% |
| Hungarians | 94.0 /100 | #121 | Exceptional 64.9% |
| Hmong | 93.4 /100 | #122 | Exceptional 64.9% |
| Choctaw | 93.4 /100 | #123 | Exceptional 64.9% |