Immigrants from Western Asia vs South African Family Households
COMPARE
Immigrants from Western Asia
South African
Family Households
Family Households Comparison
Immigrants from Western Asia
South Africans
64.1%
FAMILY HOUSEHOLDS
25.3/ 100
METRIC RATING
189th/ 347
METRIC RANK
63.4%
FAMILY HOUSEHOLDS
1.9/ 100
METRIC RATING
240th/ 347
METRIC RANK
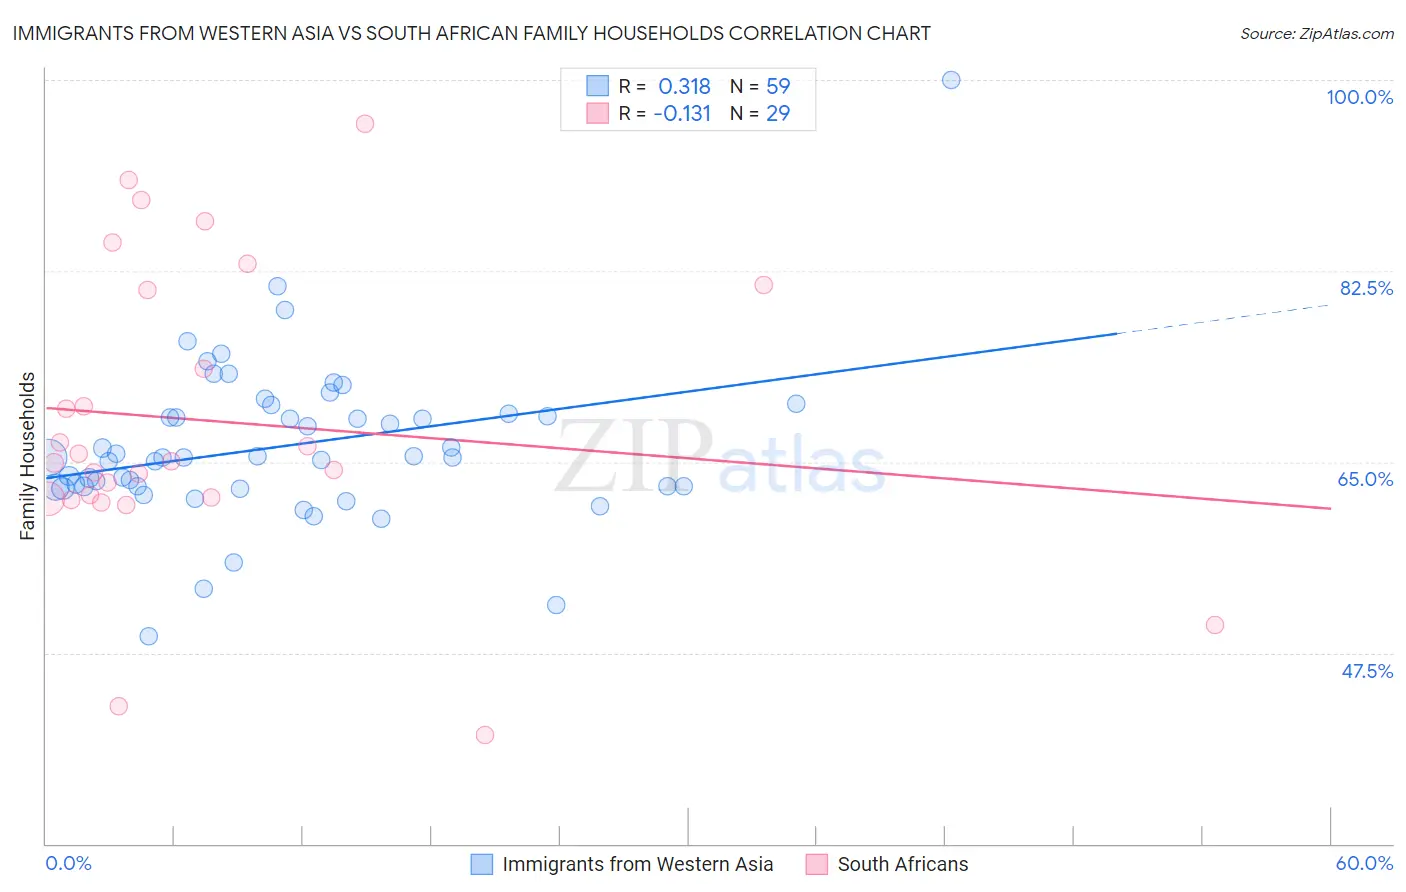
Immigrants from Western Asia vs South African Family Households Correlation Chart
The statistical analysis conducted on geographies consisting of 404,182,228 people shows a mild positive correlation between the proportion of Immigrants from Western Asia and percentage of family households in the United States with a correlation coefficient (R) of 0.318 and weighted average of 64.1%. Similarly, the statistical analysis conducted on geographies consisting of 182,542,946 people shows a poor negative correlation between the proportion of South Africans and percentage of family households in the United States with a correlation coefficient (R) of -0.131 and weighted average of 63.4%, a difference of 0.98%.
Family Households Correlation Summary
| Measurement | Immigrants from Western Asia | South African |
| Minimum | 49.0% | 40.0% |
| Maximum | 100.0% | 96.0% |
| Range | 51.0% | 56.0% |
| Mean | 66.5% | 68.7% |
| Median | 65.4% | 65.1% |
| Interquartile 25% (IQ1) | 62.8% | 61.7% |
| Interquartile 75% (IQ3) | 69.5% | 81.0% |
| Interquartile Range (IQR) | 6.7% | 19.3% |
| Standard Deviation (Sample) | 7.4% | 13.5% |
| Standard Deviation (Population) | 7.4% | 13.2% |
Similar Demographics by Family Households
Demographics Similar to Immigrants from Western Asia by Family Households
In terms of family households, the demographic groups most similar to Immigrants from Western Asia are Zimbabwean (64.1%, a difference of 0.010%), Paraguayan (64.1%, a difference of 0.020%), Arab (64.1%, a difference of 0.020%), Lithuanian (64.0%, a difference of 0.030%), and French (64.0%, a difference of 0.030%).
| Demographics | Rating | Rank | Family Households |
| Ukrainians | 34.6 /100 | #182 | Fair 64.2% |
| Creek | 34.1 /100 | #183 | Fair 64.2% |
| Puerto Ricans | 33.4 /100 | #184 | Fair 64.2% |
| Immigrants | Iran | 30.4 /100 | #185 | Fair 64.1% |
| Spanish Americans | 30.1 /100 | #186 | Fair 64.1% |
| Northern Europeans | 28.2 /100 | #187 | Fair 64.1% |
| Paraguayans | 26.7 /100 | #188 | Fair 64.1% |
| Immigrants | Western Asia | 25.3 /100 | #189 | Fair 64.1% |
| Zimbabweans | 24.7 /100 | #190 | Fair 64.1% |
| Arabs | 24.5 /100 | #191 | Fair 64.1% |
| Lithuanians | 23.8 /100 | #192 | Fair 64.0% |
| French | 23.7 /100 | #193 | Fair 64.0% |
| Paiute | 22.2 /100 | #194 | Fair 64.0% |
| Immigrants | North America | 20.0 /100 | #195 | Poor 64.0% |
| Immigrants | Canada | 19.2 /100 | #196 | Poor 64.0% |
Demographics Similar to South Africans by Family Households
In terms of family households, the demographic groups most similar to South Africans are Aleut (63.4%, a difference of 0.0%), Immigrants from St. Vincent and the Grenadines (63.4%, a difference of 0.010%), Immigrants from Israel (63.4%, a difference of 0.010%), Comanche (63.5%, a difference of 0.030%), and Immigrants from Zimbabwe (63.5%, a difference of 0.030%).
| Demographics | Rating | Rank | Family Households |
| Immigrants | Armenia | 2.6 /100 | #233 | Tragic 63.5% |
| Finns | 2.3 /100 | #234 | Tragic 63.5% |
| Albanians | 2.2 /100 | #235 | Tragic 63.5% |
| Ghanaians | 2.1 /100 | #236 | Tragic 63.5% |
| Comanche | 2.1 /100 | #237 | Tragic 63.5% |
| Immigrants | Zimbabwe | 2.0 /100 | #238 | Tragic 63.5% |
| Aleuts | 1.9 /100 | #239 | Tragic 63.4% |
| South Africans | 1.9 /100 | #240 | Tragic 63.4% |
| Immigrants | St. Vincent and the Grenadines | 1.9 /100 | #241 | Tragic 63.4% |
| Immigrants | Israel | 1.8 /100 | #242 | Tragic 63.4% |
| Immigrants | Czechoslovakia | 1.8 /100 | #243 | Tragic 63.4% |
| Eastern Europeans | 1.6 /100 | #244 | Tragic 63.4% |
| Immigrants | Dominica | 1.6 /100 | #245 | Tragic 63.4% |
| Immigrants | Ghana | 1.6 /100 | #246 | Tragic 63.4% |
| Immigrants | Uzbekistan | 1.5 /100 | #247 | Tragic 63.4% |