Barbadian vs South African Family Households
COMPARE
Barbadian
South African
Family Households
Family Households Comparison
Barbadians
South Africans
62.5%
FAMILY HOUSEHOLDS
0.0/ 100
METRIC RATING
294th/ 347
METRIC RANK
63.4%
FAMILY HOUSEHOLDS
1.9/ 100
METRIC RATING
240th/ 347
METRIC RANK
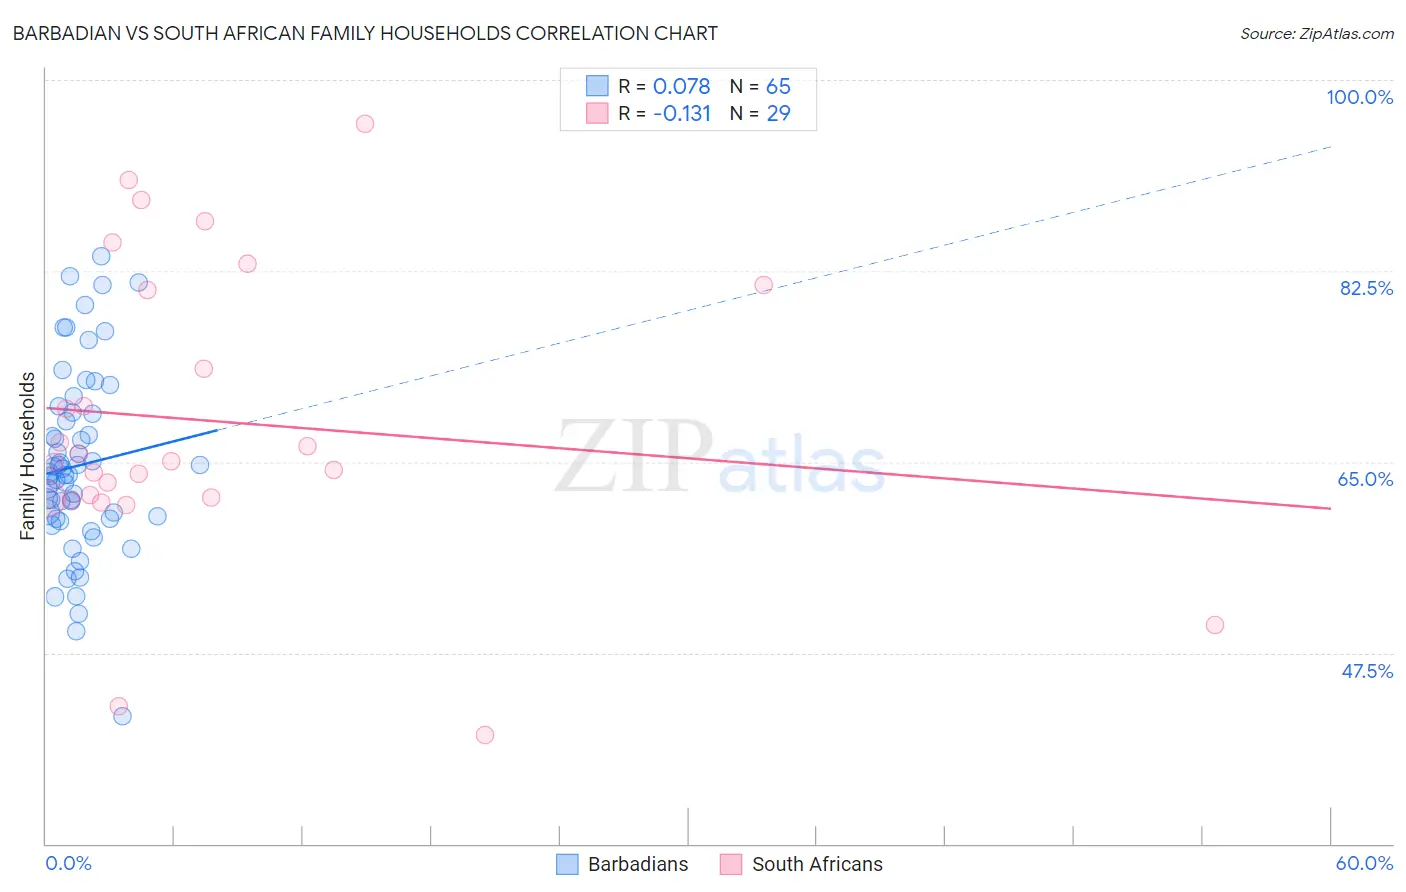
Barbadian vs South African Family Households Correlation Chart
The statistical analysis conducted on geographies consisting of 141,274,787 people shows a slight positive correlation between the proportion of Barbadians and percentage of family households in the United States with a correlation coefficient (R) of 0.078 and weighted average of 62.5%. Similarly, the statistical analysis conducted on geographies consisting of 182,542,946 people shows a poor negative correlation between the proportion of South Africans and percentage of family households in the United States with a correlation coefficient (R) of -0.131 and weighted average of 63.4%, a difference of 1.6%.
Family Households Correlation Summary
| Measurement | Barbadian | South African |
| Minimum | 41.7% | 40.0% |
| Maximum | 83.8% | 96.0% |
| Range | 42.1% | 56.0% |
| Mean | 64.7% | 68.7% |
| Median | 63.8% | 65.1% |
| Interquartile 25% (IQ1) | 59.8% | 61.7% |
| Interquartile 75% (IQ3) | 69.5% | 81.0% |
| Interquartile Range (IQR) | 9.7% | 19.3% |
| Standard Deviation (Sample) | 8.4% | 13.5% |
| Standard Deviation (Population) | 8.3% | 13.2% |
Similar Demographics by Family Households
Demographics Similar to Barbadians by Family Households
In terms of family households, the demographic groups most similar to Barbadians are Okinawan (62.5%, a difference of 0.010%), Slovene (62.4%, a difference of 0.020%), French American Indian (62.4%, a difference of 0.040%), Immigrants from Sweden (62.5%, a difference of 0.060%), and Immigrants from Spain (62.4%, a difference of 0.060%).
| Demographics | Rating | Rank | Family Households |
| Latvians | 0.1 /100 | #287 | Tragic 62.8% |
| Immigrants | Uganda | 0.1 /100 | #288 | Tragic 62.7% |
| Immigrants | Nepal | 0.1 /100 | #289 | Tragic 62.7% |
| Immigrants | Grenada | 0.0 /100 | #290 | Tragic 62.6% |
| U.S. Virgin Islanders | 0.0 /100 | #291 | Tragic 62.6% |
| Immigrants | Burma/Myanmar | 0.0 /100 | #292 | Tragic 62.6% |
| Immigrants | Sweden | 0.0 /100 | #293 | Tragic 62.5% |
| Barbadians | 0.0 /100 | #294 | Tragic 62.5% |
| Okinawans | 0.0 /100 | #295 | Tragic 62.5% |
| Slovenes | 0.0 /100 | #296 | Tragic 62.4% |
| French American Indians | 0.0 /100 | #297 | Tragic 62.4% |
| Immigrants | Spain | 0.0 /100 | #298 | Tragic 62.4% |
| Immigrants | Kuwait | 0.0 /100 | #299 | Tragic 62.4% |
| Immigrants | Africa | 0.0 /100 | #300 | Tragic 62.4% |
| Immigrants | Albania | 0.0 /100 | #301 | Tragic 62.4% |
Demographics Similar to South Africans by Family Households
In terms of family households, the demographic groups most similar to South Africans are Aleut (63.4%, a difference of 0.0%), Immigrants from St. Vincent and the Grenadines (63.4%, a difference of 0.010%), Immigrants from Israel (63.4%, a difference of 0.010%), Comanche (63.5%, a difference of 0.030%), and Immigrants from Zimbabwe (63.5%, a difference of 0.030%).
| Demographics | Rating | Rank | Family Households |
| Immigrants | Armenia | 2.6 /100 | #233 | Tragic 63.5% |
| Finns | 2.3 /100 | #234 | Tragic 63.5% |
| Albanians | 2.2 /100 | #235 | Tragic 63.5% |
| Ghanaians | 2.1 /100 | #236 | Tragic 63.5% |
| Comanche | 2.1 /100 | #237 | Tragic 63.5% |
| Immigrants | Zimbabwe | 2.0 /100 | #238 | Tragic 63.5% |
| Aleuts | 1.9 /100 | #239 | Tragic 63.4% |
| South Africans | 1.9 /100 | #240 | Tragic 63.4% |
| Immigrants | St. Vincent and the Grenadines | 1.9 /100 | #241 | Tragic 63.4% |
| Immigrants | Israel | 1.8 /100 | #242 | Tragic 63.4% |
| Immigrants | Czechoslovakia | 1.8 /100 | #243 | Tragic 63.4% |
| Eastern Europeans | 1.6 /100 | #244 | Tragic 63.4% |
| Immigrants | Dominica | 1.6 /100 | #245 | Tragic 63.4% |
| Immigrants | Ghana | 1.6 /100 | #246 | Tragic 63.4% |
| Immigrants | Uzbekistan | 1.5 /100 | #247 | Tragic 63.4% |