Cypriot vs South African Family Households
COMPARE
Cypriot
South African
Family Households
Family Households Comparison
Cypriots
South Africans
63.2%
FAMILY HOUSEHOLDS
0.6/ 100
METRIC RATING
260th/ 347
METRIC RANK
63.4%
FAMILY HOUSEHOLDS
1.9/ 100
METRIC RATING
240th/ 347
METRIC RANK
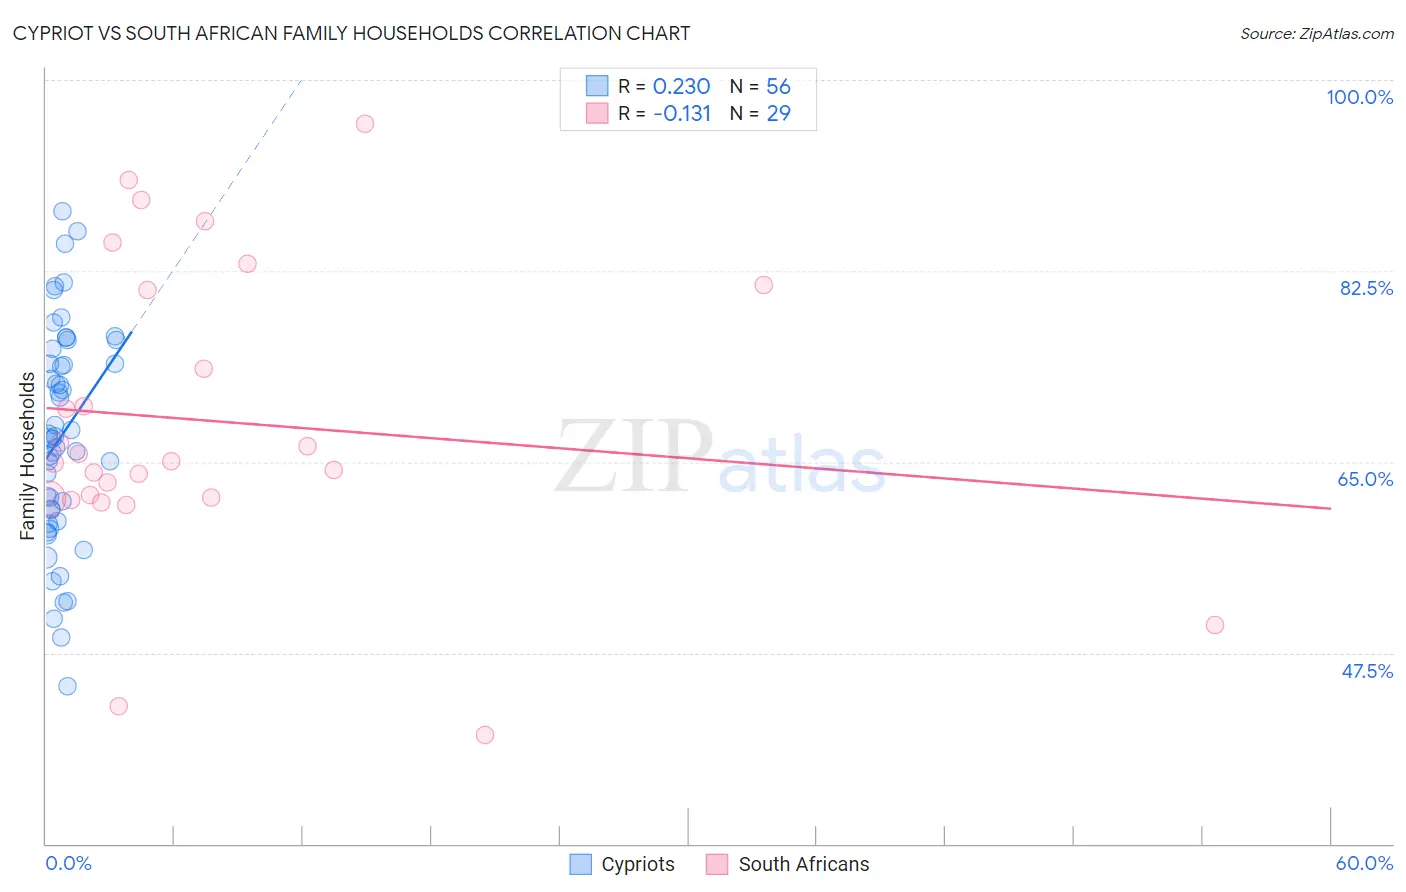
Cypriot vs South African Family Households Correlation Chart
The statistical analysis conducted on geographies consisting of 61,857,015 people shows a weak positive correlation between the proportion of Cypriots and percentage of family households in the United States with a correlation coefficient (R) of 0.230 and weighted average of 63.2%. Similarly, the statistical analysis conducted on geographies consisting of 182,542,946 people shows a poor negative correlation between the proportion of South Africans and percentage of family households in the United States with a correlation coefficient (R) of -0.131 and weighted average of 63.4%, a difference of 0.40%.
Family Households Correlation Summary
| Measurement | Cypriot | South African |
| Minimum | 44.4% | 40.0% |
| Maximum | 87.9% | 96.0% |
| Range | 43.5% | 56.0% |
| Mean | 67.4% | 68.7% |
| Median | 67.3% | 65.1% |
| Interquartile 25% (IQ1) | 60.0% | 61.7% |
| Interquartile 75% (IQ3) | 74.7% | 81.0% |
| Interquartile Range (IQR) | 14.7% | 19.3% |
| Standard Deviation (Sample) | 9.9% | 13.5% |
| Standard Deviation (Population) | 9.8% | 13.2% |
Demographics Similar to Cypriots and South Africans by Family Households
In terms of family households, the demographic groups most similar to Cypriots are Immigrants from Western Europe (63.2%, a difference of 0.020%), Immigrants from Barbados (63.2%, a difference of 0.030%), Icelander (63.3%, a difference of 0.10%), Luxembourger (63.3%, a difference of 0.14%), and Potawatomi (63.3%, a difference of 0.16%). Similarly, the demographic groups most similar to South Africans are Immigrants from St. Vincent and the Grenadines (63.4%, a difference of 0.010%), Immigrants from Israel (63.4%, a difference of 0.010%), Immigrants from Czechoslovakia (63.4%, a difference of 0.030%), Eastern European (63.4%, a difference of 0.050%), and Immigrants from Dominica (63.4%, a difference of 0.050%).
| Demographics | Rating | Rank | Family Households |
| South Africans | 1.9 /100 | #240 | Tragic 63.4% |
| Immigrants | St. Vincent and the Grenadines | 1.9 /100 | #241 | Tragic 63.4% |
| Immigrants | Israel | 1.8 /100 | #242 | Tragic 63.4% |
| Immigrants | Czechoslovakia | 1.8 /100 | #243 | Tragic 63.4% |
| Eastern Europeans | 1.6 /100 | #244 | Tragic 63.4% |
| Immigrants | Dominica | 1.6 /100 | #245 | Tragic 63.4% |
| Immigrants | Ghana | 1.6 /100 | #246 | Tragic 63.4% |
| Immigrants | Uzbekistan | 1.5 /100 | #247 | Tragic 63.4% |
| Dominicans | 1.5 /100 | #248 | Tragic 63.4% |
| Russians | 1.4 /100 | #249 | Tragic 63.4% |
| Immigrants | Japan | 1.4 /100 | #250 | Tragic 63.4% |
| Taiwanese | 1.2 /100 | #251 | Tragic 63.3% |
| Bahamians | 1.1 /100 | #252 | Tragic 63.3% |
| Immigrants | Dominican Republic | 1.0 /100 | #253 | Tragic 63.3% |
| Slovaks | 1.0 /100 | #254 | Tragic 63.3% |
| Potawatomi | 1.0 /100 | #255 | Tragic 63.3% |
| Luxembourgers | 0.9 /100 | #256 | Tragic 63.3% |
| Icelanders | 0.8 /100 | #257 | Tragic 63.3% |
| Immigrants | Barbados | 0.7 /100 | #258 | Tragic 63.2% |
| Immigrants | Western Europe | 0.6 /100 | #259 | Tragic 63.2% |
| Cypriots | 0.6 /100 | #260 | Tragic 63.2% |