Immigrants from Scotland vs Macedonian Married-couple Households
COMPARE
Immigrants from Scotland
Macedonian
Married-couple Households
Married-couple Households Comparison
Immigrants from Scotland
Macedonians
49.3%
MARRIED-COUPLE HOUSEHOLDS
99.8/ 100
METRIC RATING
26th/ 347
METRIC RANK
47.6%
MARRIED-COUPLE HOUSEHOLDS
93.9/ 100
METRIC RATING
110th/ 347
METRIC RANK
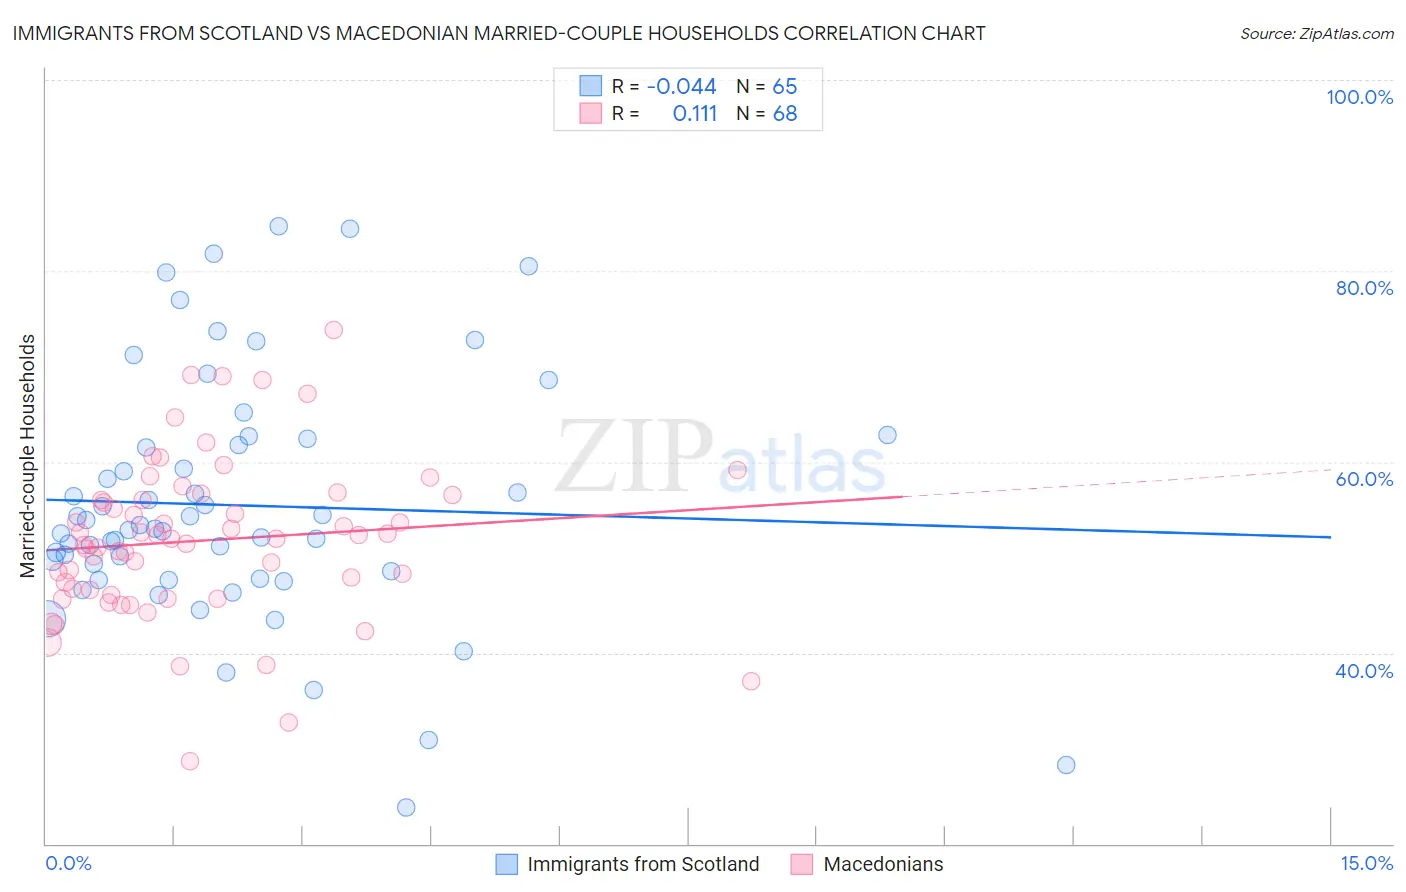
Immigrants from Scotland vs Macedonian Married-couple Households Correlation Chart
The statistical analysis conducted on geographies consisting of 196,383,501 people shows no correlation between the proportion of Immigrants from Scotland and percentage of married-couple family households in the United States with a correlation coefficient (R) of -0.044 and weighted average of 49.3%. Similarly, the statistical analysis conducted on geographies consisting of 132,608,945 people shows a poor positive correlation between the proportion of Macedonians and percentage of married-couple family households in the United States with a correlation coefficient (R) of 0.111 and weighted average of 47.6%, a difference of 3.4%.
Married-couple Households Correlation Summary
| Measurement | Immigrants from Scotland | Macedonian |
| Minimum | 23.8% | 28.7% |
| Maximum | 84.6% | 73.8% |
| Range | 60.9% | 45.2% |
| Mean | 55.5% | 51.8% |
| Median | 53.0% | 52.0% |
| Interquartile 25% (IQ1) | 48.2% | 46.3% |
| Interquartile 75% (IQ3) | 62.1% | 56.3% |
| Interquartile Range (IQR) | 13.9% | 10.0% |
| Standard Deviation (Sample) | 12.8% | 8.4% |
| Standard Deviation (Population) | 12.7% | 8.3% |
Similar Demographics by Married-couple Households
Demographics Similar to Immigrants from Scotland by Married-couple Households
In terms of married-couple households, the demographic groups most similar to Immigrants from Scotland are Bhutanese (49.3%, a difference of 0.020%), Immigrants from Philippines (49.3%, a difference of 0.13%), German (49.2%, a difference of 0.21%), Maltese (49.2%, a difference of 0.22%), and Bolivian (49.2%, a difference of 0.23%).
| Demographics | Rating | Rank | Married-couple Households |
| Europeans | 99.9 /100 | #19 | Exceptional 49.6% |
| Scandinavians | 99.9 /100 | #20 | Exceptional 49.6% |
| Norwegians | 99.9 /100 | #21 | Exceptional 49.5% |
| Asians | 99.9 /100 | #22 | Exceptional 49.5% |
| Dutch | 99.9 /100 | #23 | Exceptional 49.5% |
| Czechs | 99.9 /100 | #24 | Exceptional 49.4% |
| Immigrants | Philippines | 99.9 /100 | #25 | Exceptional 49.3% |
| Immigrants | Scotland | 99.8 /100 | #26 | Exceptional 49.3% |
| Bhutanese | 99.8 /100 | #27 | Exceptional 49.3% |
| Germans | 99.8 /100 | #28 | Exceptional 49.2% |
| Maltese | 99.8 /100 | #29 | Exceptional 49.2% |
| Bolivians | 99.8 /100 | #30 | Exceptional 49.2% |
| Native Hawaiians | 99.8 /100 | #31 | Exceptional 49.1% |
| Hungarians | 99.8 /100 | #32 | Exceptional 49.1% |
| Immigrants | Asia | 99.7 /100 | #33 | Exceptional 49.1% |
Demographics Similar to Macedonians by Married-couple Households
In terms of married-couple households, the demographic groups most similar to Macedonians are Syrian (47.6%, a difference of 0.0%), Immigrants from Jordan (47.7%, a difference of 0.020%), Peruvian (47.6%, a difference of 0.020%), Venezuelan (47.6%, a difference of 0.030%), and Immigrants from Europe (47.6%, a difference of 0.030%).
| Demographics | Rating | Rank | Married-couple Households |
| Hawaiians | 96.0 /100 | #103 | Exceptional 47.8% |
| Immigrants | South Africa | 96.0 /100 | #104 | Exceptional 47.8% |
| Immigrants | Czechoslovakia | 95.5 /100 | #105 | Exceptional 47.8% |
| Portuguese | 95.5 /100 | #106 | Exceptional 47.8% |
| Estonians | 94.7 /100 | #107 | Exceptional 47.7% |
| Immigrants | Japan | 94.4 /100 | #108 | Exceptional 47.7% |
| Immigrants | Jordan | 94.1 /100 | #109 | Exceptional 47.7% |
| Macedonians | 93.9 /100 | #110 | Exceptional 47.6% |
| Syrians | 93.9 /100 | #111 | Exceptional 47.6% |
| Peruvians | 93.8 /100 | #112 | Exceptional 47.6% |
| Venezuelans | 93.8 /100 | #113 | Exceptional 47.6% |
| Immigrants | Europe | 93.7 /100 | #114 | Exceptional 47.6% |
| Slovaks | 92.9 /100 | #115 | Exceptional 47.6% |
| Argentineans | 92.5 /100 | #116 | Exceptional 47.5% |
| French Canadians | 92.4 /100 | #117 | Exceptional 47.5% |