Alaskan Athabascan vs Comanche Married-couple Households
COMPARE
Alaskan Athabascan
Comanche
Married-couple Households
Married-couple Households Comparison
Alaskan Athabascans
Comanche
43.6%
MARRIED-COUPLE HOUSEHOLDS
0.2/ 100
METRIC RATING
261st/ 347
METRIC RANK
44.5%
MARRIED-COUPLE HOUSEHOLDS
1.2/ 100
METRIC RATING
237th/ 347
METRIC RANK
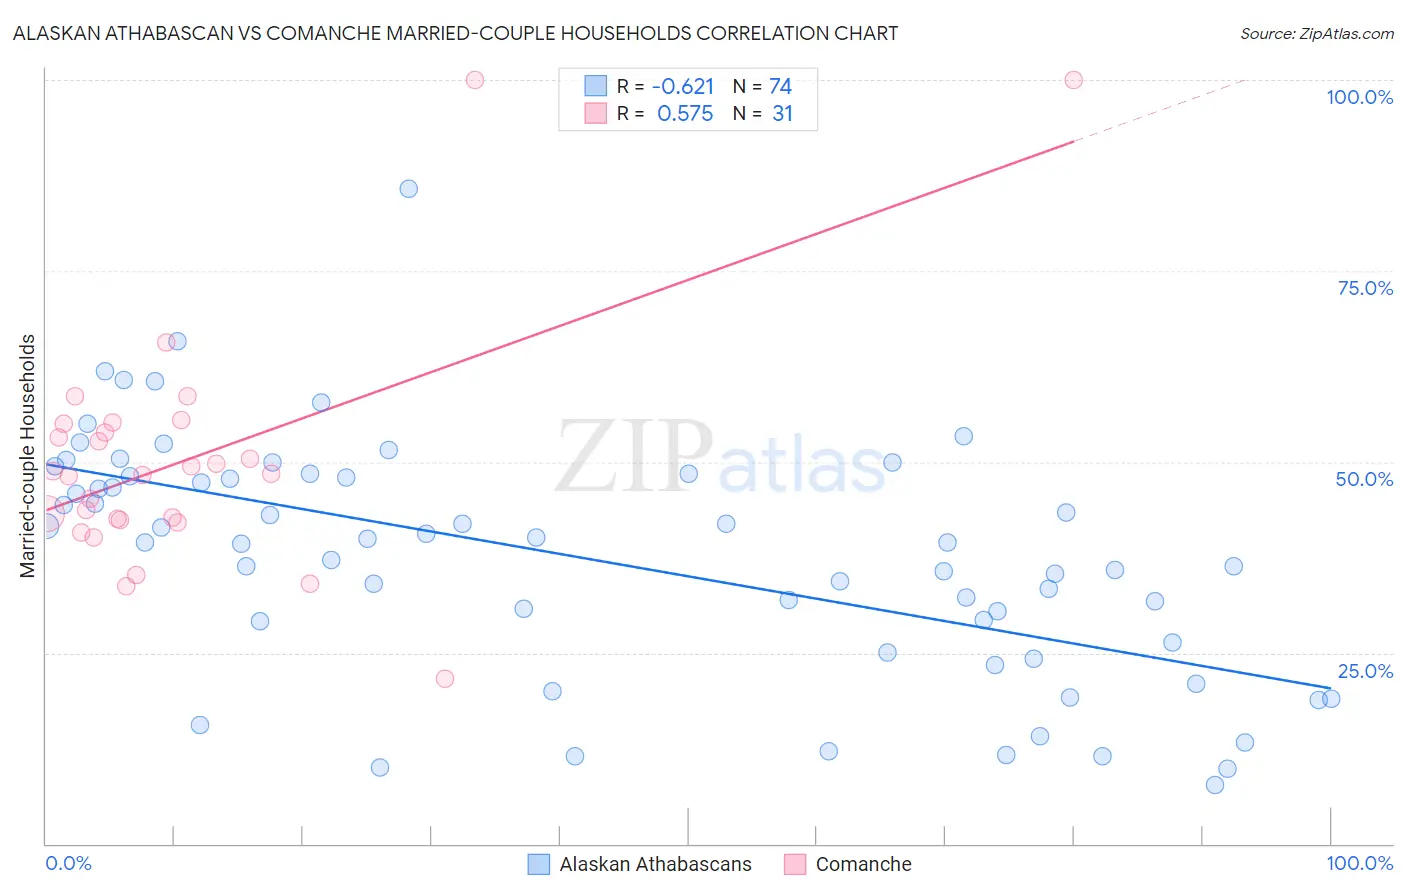
Alaskan Athabascan vs Comanche Married-couple Households Correlation Chart
The statistical analysis conducted on geographies consisting of 45,814,810 people shows a significant negative correlation between the proportion of Alaskan Athabascans and percentage of married-couple family households in the United States with a correlation coefficient (R) of -0.621 and weighted average of 43.6%. Similarly, the statistical analysis conducted on geographies consisting of 109,768,112 people shows a substantial positive correlation between the proportion of Comanche and percentage of married-couple family households in the United States with a correlation coefficient (R) of 0.575 and weighted average of 44.5%, a difference of 2.0%.
Married-couple Households Correlation Summary
| Measurement | Alaskan Athabascan | Comanche |
| Minimum | 7.7% | 21.6% |
| Maximum | 85.7% | 100.0% |
| Range | 78.0% | 78.4% |
| Mean | 37.3% | 50.3% |
| Median | 39.4% | 48.4% |
| Interquartile 25% (IQ1) | 26.4% | 42.4% |
| Interquartile 75% (IQ3) | 48.1% | 55.0% |
| Interquartile Range (IQR) | 21.7% | 12.6% |
| Standard Deviation (Sample) | 15.6% | 15.9% |
| Standard Deviation (Population) | 15.5% | 15.6% |
Similar Demographics by Married-couple Households
Demographics Similar to Alaskan Athabascans by Married-couple Households
In terms of married-couple households, the demographic groups most similar to Alaskan Athabascans are Vietnamese (43.6%, a difference of 0.060%), Immigrants from Cameroon (43.7%, a difference of 0.13%), Cree (43.6%, a difference of 0.17%), Iroquois (43.7%, a difference of 0.22%), and Central American Indian (43.8%, a difference of 0.25%).
| Demographics | Rating | Rank | Married-couple Households |
| Apache | 0.3 /100 | #254 | Tragic 43.9% |
| Shoshone | 0.3 /100 | #255 | Tragic 43.9% |
| Ugandans | 0.3 /100 | #256 | Tragic 43.8% |
| Blackfeet | 0.2 /100 | #257 | Tragic 43.8% |
| Central American Indians | 0.2 /100 | #258 | Tragic 43.8% |
| Iroquois | 0.2 /100 | #259 | Tragic 43.7% |
| Immigrants | Cameroon | 0.2 /100 | #260 | Tragic 43.7% |
| Alaskan Athabascans | 0.2 /100 | #261 | Tragic 43.6% |
| Vietnamese | 0.2 /100 | #262 | Tragic 43.6% |
| Cree | 0.1 /100 | #263 | Tragic 43.6% |
| Bangladeshis | 0.1 /100 | #264 | Tragic 43.5% |
| Moroccans | 0.1 /100 | #265 | Tragic 43.5% |
| Ecuadorians | 0.1 /100 | #266 | Tragic 43.5% |
| Natives/Alaskans | 0.1 /100 | #267 | Tragic 43.5% |
| Immigrants | Burma/Myanmar | 0.1 /100 | #268 | Tragic 43.4% |
Demographics Similar to Comanche by Married-couple Households
In terms of married-couple households, the demographic groups most similar to Comanche are Yaqui (44.5%, a difference of 0.030%), Immigrants from Nicaragua (44.5%, a difference of 0.040%), Immigrants from Uruguay (44.5%, a difference of 0.050%), Spanish American (44.5%, a difference of 0.070%), and Immigrants from Panama (44.6%, a difference of 0.11%).
| Demographics | Rating | Rank | Married-couple Households |
| Soviet Union | 1.6 /100 | #230 | Tragic 44.6% |
| Houma | 1.5 /100 | #231 | Tragic 44.6% |
| Marshallese | 1.5 /100 | #232 | Tragic 44.6% |
| Immigrants | Uganda | 1.5 /100 | #233 | Tragic 44.6% |
| Immigrants | Panama | 1.3 /100 | #234 | Tragic 44.6% |
| Immigrants | Nicaragua | 1.2 /100 | #235 | Tragic 44.5% |
| Yaqui | 1.2 /100 | #236 | Tragic 44.5% |
| Comanche | 1.2 /100 | #237 | Tragic 44.5% |
| Immigrants | Uruguay | 1.1 /100 | #238 | Tragic 44.5% |
| Spanish Americans | 1.1 /100 | #239 | Tragic 44.5% |
| Ute | 1.0 /100 | #240 | Tragic 44.4% |
| Immigrants | Bosnia and Herzegovina | 1.0 /100 | #241 | Tragic 44.4% |
| Immigrants | Albania | 1.0 /100 | #242 | Tragic 44.4% |
| Immigrants | Saudi Arabia | 0.9 /100 | #243 | Tragic 44.4% |
| Immigrants | Armenia | 0.7 /100 | #244 | Tragic 44.3% |