Hungarian vs Immigrants from Syria Family Households
COMPARE
Hungarian
Immigrants from Syria
Family Households
Family Households Comparison
Hungarians
Immigrants from Syria
64.9%
FAMILY HOUSEHOLDS
94.0/ 100
METRIC RATING
121st/ 347
METRIC RANK
65.2%
FAMILY HOUSEHOLDS
98.4/ 100
METRIC RATING
98th/ 347
METRIC RANK
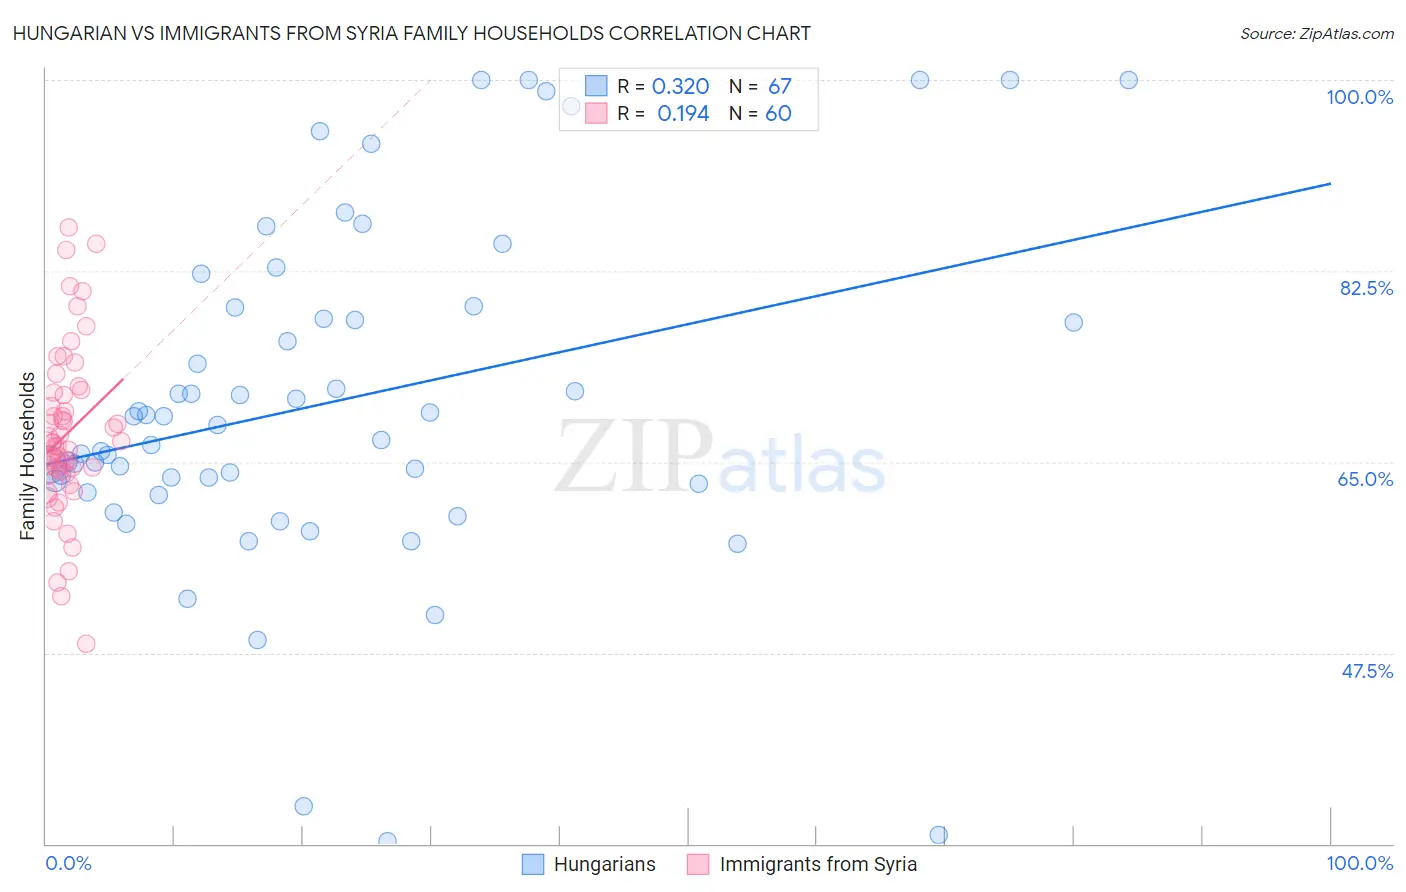
Hungarian vs Immigrants from Syria Family Households Correlation Chart
The statistical analysis conducted on geographies consisting of 485,906,921 people shows a mild positive correlation between the proportion of Hungarians and percentage of family households in the United States with a correlation coefficient (R) of 0.320 and weighted average of 64.9%. Similarly, the statistical analysis conducted on geographies consisting of 174,105,874 people shows a poor positive correlation between the proportion of Immigrants from Syria and percentage of family households in the United States with a correlation coefficient (R) of 0.194 and weighted average of 65.2%, a difference of 0.45%.
Family Households Correlation Summary
| Measurement | Hungarian | Immigrants from Syria |
| Minimum | 30.2% | 48.3% |
| Maximum | 100.0% | 86.5% |
| Range | 69.8% | 38.3% |
| Mean | 70.5% | 67.5% |
| Median | 68.4% | 66.6% |
| Interquartile 25% (IQ1) | 63.0% | 64.0% |
| Interquartile 75% (IQ3) | 79.1% | 71.2% |
| Interquartile Range (IQR) | 16.1% | 7.2% |
| Standard Deviation (Sample) | 15.7% | 7.6% |
| Standard Deviation (Population) | 15.6% | 7.5% |
Similar Demographics by Family Households
Demographics Similar to Hungarians by Family Households
In terms of family households, the demographic groups most similar to Hungarians are Immigrants from Oceania (64.9%, a difference of 0.010%), Immigrants from Eastern Asia (64.9%, a difference of 0.020%), Hmong (64.9%, a difference of 0.040%), Choctaw (64.9%, a difference of 0.040%), and Immigrants from Argentina (64.9%, a difference of 0.060%).
| Demographics | Rating | Rank | Family Households |
| Argentineans | 95.7 /100 | #114 | Exceptional 65.0% |
| Ecuadorians | 95.4 /100 | #115 | Exceptional 65.0% |
| Immigrants | Iraq | 95.4 /100 | #116 | Exceptional 65.0% |
| Cherokee | 95.3 /100 | #117 | Exceptional 65.0% |
| Dutch | 95.1 /100 | #118 | Exceptional 64.9% |
| Immigrants | Eastern Asia | 94.4 /100 | #119 | Exceptional 64.9% |
| Immigrants | Oceania | 94.2 /100 | #120 | Exceptional 64.9% |
| Hungarians | 94.0 /100 | #121 | Exceptional 64.9% |
| Hmong | 93.4 /100 | #122 | Exceptional 64.9% |
| Choctaw | 93.4 /100 | #123 | Exceptional 64.9% |
| Immigrants | Argentina | 92.8 /100 | #124 | Exceptional 64.9% |
| Immigrants | Belize | 92.7 /100 | #125 | Exceptional 64.9% |
| Panamanians | 92.4 /100 | #126 | Exceptional 64.8% |
| Immigrants | Panama | 92.0 /100 | #127 | Exceptional 64.8% |
| Italians | 91.9 /100 | #128 | Exceptional 64.8% |
Demographics Similar to Immigrants from Syria by Family Households
In terms of family households, the demographic groups most similar to Immigrants from Syria are Central American Indian (65.2%, a difference of 0.020%), Swiss (65.2%, a difference of 0.040%), Guatemalan (65.2%, a difference of 0.040%), Immigrants from Portugal (65.2%, a difference of 0.050%), and Haitian (65.2%, a difference of 0.060%).
| Demographics | Rating | Rank | Family Households |
| Crow | 98.9 /100 | #91 | Exceptional 65.3% |
| Hopi | 98.8 /100 | #92 | Exceptional 65.3% |
| Guyanese | 98.8 /100 | #93 | Exceptional 65.3% |
| Immigrants | Poland | 98.7 /100 | #94 | Exceptional 65.2% |
| Immigrants | Portugal | 98.6 /100 | #95 | Exceptional 65.2% |
| Swiss | 98.6 /100 | #96 | Exceptional 65.2% |
| Guatemalans | 98.6 /100 | #97 | Exceptional 65.2% |
| Immigrants | Syria | 98.4 /100 | #98 | Exceptional 65.2% |
| Central American Indians | 98.3 /100 | #99 | Exceptional 65.2% |
| Haitians | 98.1 /100 | #100 | Exceptional 65.2% |
| Chileans | 98.1 /100 | #101 | Exceptional 65.2% |
| Immigrants | Sri Lanka | 98.0 /100 | #102 | Exceptional 65.1% |
| Indians (Asian) | 97.9 /100 | #103 | Exceptional 65.1% |
| Spaniards | 97.8 /100 | #104 | Exceptional 65.1% |
| English | 97.4 /100 | #105 | Exceptional 65.1% |