Hungarian vs Immigrants from Western Asia Family Households
COMPARE
Hungarian
Immigrants from Western Asia
Family Households
Family Households Comparison
Hungarians
Immigrants from Western Asia
64.9%
FAMILY HOUSEHOLDS
94.0/ 100
METRIC RATING
121st/ 347
METRIC RANK
64.1%
FAMILY HOUSEHOLDS
25.3/ 100
METRIC RATING
189th/ 347
METRIC RANK
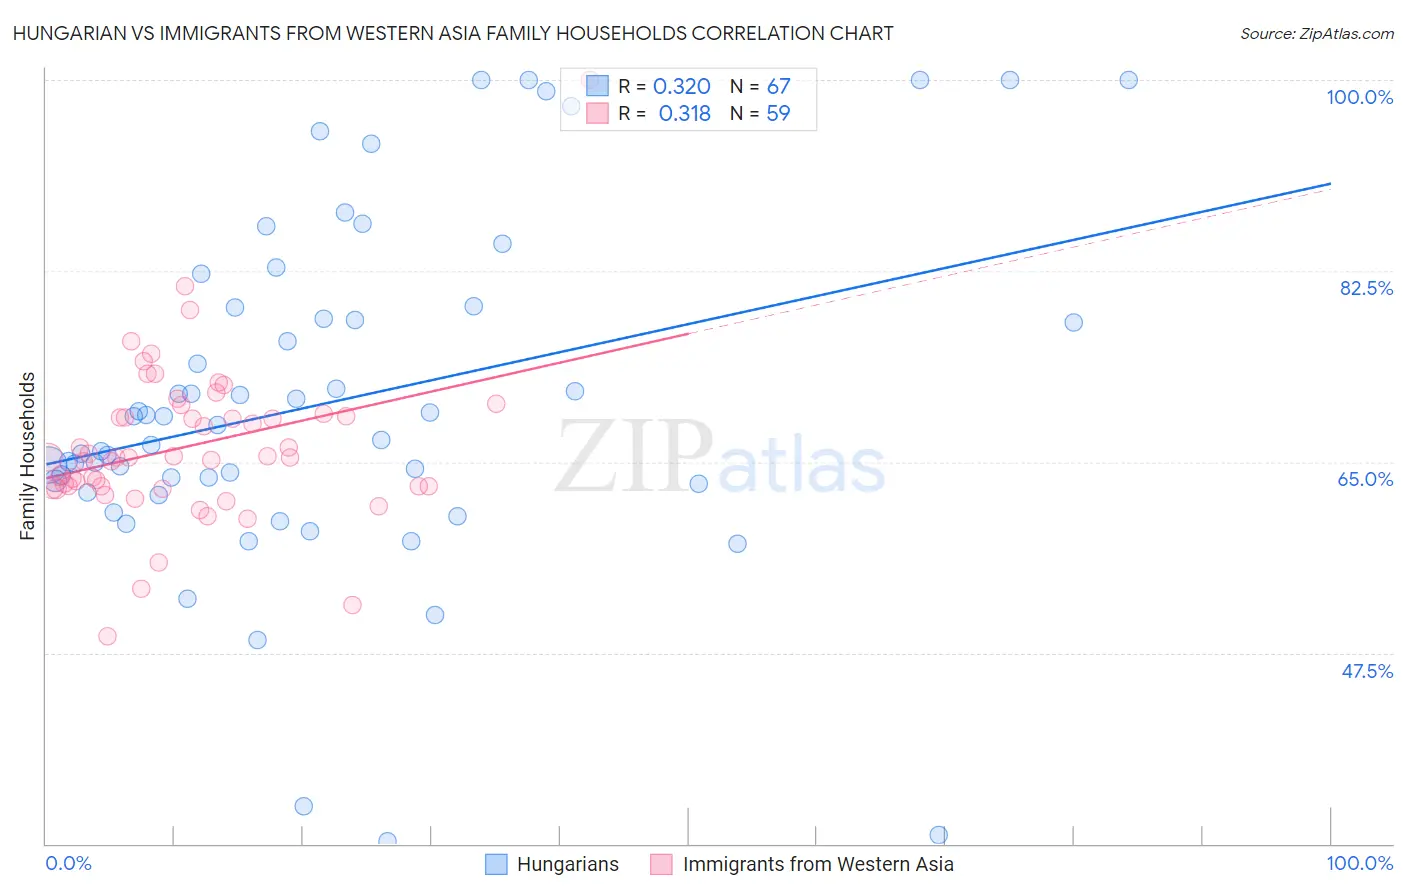
Hungarian vs Immigrants from Western Asia Family Households Correlation Chart
The statistical analysis conducted on geographies consisting of 485,906,921 people shows a mild positive correlation between the proportion of Hungarians and percentage of family households in the United States with a correlation coefficient (R) of 0.320 and weighted average of 64.9%. Similarly, the statistical analysis conducted on geographies consisting of 404,182,228 people shows a mild positive correlation between the proportion of Immigrants from Western Asia and percentage of family households in the United States with a correlation coefficient (R) of 0.318 and weighted average of 64.1%, a difference of 1.3%.
Family Households Correlation Summary
| Measurement | Hungarian | Immigrants from Western Asia |
| Minimum | 30.2% | 49.0% |
| Maximum | 100.0% | 100.0% |
| Range | 69.8% | 51.0% |
| Mean | 70.5% | 66.5% |
| Median | 68.4% | 65.4% |
| Interquartile 25% (IQ1) | 63.0% | 62.8% |
| Interquartile 75% (IQ3) | 79.1% | 69.5% |
| Interquartile Range (IQR) | 16.1% | 6.7% |
| Standard Deviation (Sample) | 15.7% | 7.4% |
| Standard Deviation (Population) | 15.6% | 7.4% |
Similar Demographics by Family Households
Demographics Similar to Hungarians by Family Households
In terms of family households, the demographic groups most similar to Hungarians are Immigrants from Oceania (64.9%, a difference of 0.010%), Immigrants from Eastern Asia (64.9%, a difference of 0.020%), Hmong (64.9%, a difference of 0.040%), Choctaw (64.9%, a difference of 0.040%), and Immigrants from Argentina (64.9%, a difference of 0.060%).
| Demographics | Rating | Rank | Family Households |
| Argentineans | 95.7 /100 | #114 | Exceptional 65.0% |
| Ecuadorians | 95.4 /100 | #115 | Exceptional 65.0% |
| Immigrants | Iraq | 95.4 /100 | #116 | Exceptional 65.0% |
| Cherokee | 95.3 /100 | #117 | Exceptional 65.0% |
| Dutch | 95.1 /100 | #118 | Exceptional 64.9% |
| Immigrants | Eastern Asia | 94.4 /100 | #119 | Exceptional 64.9% |
| Immigrants | Oceania | 94.2 /100 | #120 | Exceptional 64.9% |
| Hungarians | 94.0 /100 | #121 | Exceptional 64.9% |
| Hmong | 93.4 /100 | #122 | Exceptional 64.9% |
| Choctaw | 93.4 /100 | #123 | Exceptional 64.9% |
| Immigrants | Argentina | 92.8 /100 | #124 | Exceptional 64.9% |
| Immigrants | Belize | 92.7 /100 | #125 | Exceptional 64.9% |
| Panamanians | 92.4 /100 | #126 | Exceptional 64.8% |
| Immigrants | Panama | 92.0 /100 | #127 | Exceptional 64.8% |
| Italians | 91.9 /100 | #128 | Exceptional 64.8% |
Demographics Similar to Immigrants from Western Asia by Family Households
In terms of family households, the demographic groups most similar to Immigrants from Western Asia are Zimbabwean (64.1%, a difference of 0.010%), Paraguayan (64.1%, a difference of 0.020%), Arab (64.1%, a difference of 0.020%), Lithuanian (64.0%, a difference of 0.030%), and French (64.0%, a difference of 0.030%).
| Demographics | Rating | Rank | Family Households |
| Ukrainians | 34.6 /100 | #182 | Fair 64.2% |
| Creek | 34.1 /100 | #183 | Fair 64.2% |
| Puerto Ricans | 33.4 /100 | #184 | Fair 64.2% |
| Immigrants | Iran | 30.4 /100 | #185 | Fair 64.1% |
| Spanish Americans | 30.1 /100 | #186 | Fair 64.1% |
| Northern Europeans | 28.2 /100 | #187 | Fair 64.1% |
| Paraguayans | 26.7 /100 | #188 | Fair 64.1% |
| Immigrants | Western Asia | 25.3 /100 | #189 | Fair 64.1% |
| Zimbabweans | 24.7 /100 | #190 | Fair 64.1% |
| Arabs | 24.5 /100 | #191 | Fair 64.1% |
| Lithuanians | 23.8 /100 | #192 | Fair 64.0% |
| French | 23.7 /100 | #193 | Fair 64.0% |
| Paiute | 22.2 /100 | #194 | Fair 64.0% |
| Immigrants | North America | 20.0 /100 | #195 | Poor 64.0% |
| Immigrants | Canada | 19.2 /100 | #196 | Poor 64.0% |