Hungarian vs Immigrants from Syria Single Father Poverty

COMPARE

Hungarian
Race
Ancestry
AfghanAfricanAlaska NativeAlaskan AthabascanAlbanianAleutAlsatianAmericanApacheArabArapahoArgentineanArmenianAssyrian/Chaldean/SyriacAustralianAustrianBahamianBangladeshiBarbadianBasqueBelgianBelizeanBermudanBhutaneseBlackfeetBolivianBrazilianBritishBritish West IndianBulgarianBurmeseCajunCambodianCanadianCape VerdeanCarpatho RusynCelticCentral AmericanCentral American IndianCherokeeCheyenneChickasawChileanChineseChippewaChoctawColombianColvilleComancheCosta RicanCreeCreekCroatianCrowCubanCypriotCzechCzechoslovakianDanishDelawareDominicanDutchDutch West IndianEastern EuropeanEcuadorianEgyptianEnglishEstonianEthiopianEuropeanFijianFilipinoFinnishFrenchFrench American IndianFrench CanadianGermanGerman RussianGhanaianGreekGuamanian/ChamorroGuatemalanGuyaneseHaitianHmongHonduranHopiHoumaHungarianIcelanderIndian (Asian)IndonesianInupiatIranianIraqiIrishIroquoisIsraeliItalianJamaicanJapaneseJordanianKenyanKiowaKoreanLaotianLatvianLebaneseLiberianLithuanianLumbeeLuxembourgerMacedonianMalaysianMalteseMarshalleseMenomineeMexicanMexican American IndianMongolianMoroccanNative HawaiianNavajoNepaleseNew ZealanderNicaraguanNigerianNorthern EuropeanNorwegianOkinawanOsageOttawaPaiutePakistaniPalestinianPanamanianParaguayanPennsylvania GermanPeruvianPimaPolishPortuguesePotawatomiPuebloPuerto RicanPuget Sound SalishRomanianRussianSalvadoranSamoanScandinavianScotch-IrishScottishSeminoleSenegaleseSerbianShoshoneSierra LeoneanSiouxSlavicSlovakSloveneSomaliSouth AfricanSouth AmericanSouth American IndianSoviet UnionSpaniardSpanishSpanish AmericanSpanish American IndianSri LankanSubsaharan AfricanSudaneseSwedishSwissSyrianTaiwaneseThaiTlingit-HaidaTohono O'OdhamTonganTrinidadian and TobagonianTsimshianTurkishU.S. Virgin IslanderUgandanUkrainianUruguayanUteVenezuelanVietnameseWelshWest IndianYakamaYaquiYugoslavianYumanYup'ikZimbabwean
Immigration
NonimmigrantsImmigrantsAfghanistanAfricaAlbaniaArgentinaArmeniaAsiaAustraliaAustriaBahamasBangladeshBarbadosBelarusBelgiumBelizeBoliviaBosnia and HerzegovinaBrazilBulgariaBurma/MyanmarCabo VerdeCambodiaCameroonCanadaCaribbeanCentral AmericaChileChinaColombiaCongoCosta RicaCroatiaCubaCzechoslovakiaDenmarkDominicaDominican RepublicEastern AfricaEastern AsiaEastern EuropeEcuadorEgyptEl SalvadorEnglandEritreaEthiopiaEuropeFijiFranceGermanyGhanaGreeceGrenadaGuatemalaGuyanaHaitiHondurasHong KongHungaryIndiaIndonesiaIranIraqIrelandIsraelItalyJamaicaJapanJordanKazakhstanKenyaKoreaKuwaitLaosLatin AmericaLatviaLebanonLiberiaLithuaniaMalaysiaMexicoMicronesiaMiddle AfricaMoldovaMoroccoNepalNetherlandsNicaraguaNigeriaNorth AmericaNorth MacedoniaNorthern AfricaNorthern EuropeNorwayOceaniaPakistanPanamaPeruPhilippinesPolandPortugalRomaniaRussiaSaudi ArabiaScotlandSenegalSerbiaSierra LeoneSingaporeSomaliaSouth AfricaSouth AmericaSouth Central AsiaSouth Eastern AsiaSouthern EuropeSpainSri LankaSt. Vincent and the GrenadinesSudanSwedenSwitzerlandTaiwanThailandTrinidad and TobagoTurkeyUgandaUkraineUruguayUzbekistanVenezuelaVietnamWest IndiesWestern AfricaWestern AsiaWestern EuropeYemenZaireZimbabweAzores
Immigrants from Syria
Race
Ancestry
AfghanAfricanAlaska NativeAlaskan AthabascanAlbanianAleutAlsatianAmericanApacheArabArapahoArgentineanArmenianAssyrian/Chaldean/SyriacAustralianAustrianBahamianBangladeshiBarbadianBasqueBelgianBelizeanBermudanBhutaneseBlackfeetBolivianBrazilianBritishBritish West IndianBulgarianBurmeseCajunCambodianCanadianCape VerdeanCarpatho RusynCelticCentral AmericanCentral American IndianCherokeeCheyenneChickasawChileanChineseChippewaChoctawColombianColvilleComancheCosta RicanCreeCreekCroatianCrowCubanCypriotCzechCzechoslovakianDanishDelawareDominicanDutchDutch West IndianEastern EuropeanEcuadorianEgyptianEnglishEstonianEthiopianEuropeanFijianFilipinoFinnishFrenchFrench American IndianFrench CanadianGermanGerman RussianGhanaianGreekGuamanian/ChamorroGuatemalanGuyaneseHaitianHmongHonduranHopiHoumaIcelanderIndian (Asian)IndonesianInupiatIranianIraqiIrishIroquoisIsraeliItalianJamaicanJapaneseJordanianKenyanKiowaKoreanLaotianLatvianLebaneseLiberianLithuanianLumbeeLuxembourgerMacedonianMalaysianMalteseMarshalleseMenomineeMexicanMexican American IndianMongolianMoroccanNative HawaiianNavajoNepaleseNew ZealanderNicaraguanNigerianNorthern EuropeanNorwegianOkinawanOsageOttawaPaiutePakistaniPalestinianPanamanianParaguayanPennsylvania GermanPeruvianPimaPolishPortuguesePotawatomiPuebloPuerto RicanPuget Sound SalishRomanianRussianSalvadoranSamoanScandinavianScotch-IrishScottishSeminoleSenegaleseSerbianShoshoneSierra LeoneanSiouxSlavicSlovakSloveneSomaliSouth AfricanSouth AmericanSouth American IndianSoviet UnionSpaniardSpanishSpanish AmericanSpanish American IndianSri LankanSubsaharan AfricanSudaneseSwedishSwissSyrianTaiwaneseThaiTlingit-HaidaTohono O'OdhamTonganTrinidadian and TobagonianTsimshianTurkishU.S. Virgin IslanderUgandanUkrainianUruguayanUteVenezuelanVietnameseWelshWest IndianYakamaYaquiYugoslavianYumanYup'ikZimbabwean
Immigration
NonimmigrantsImmigrantsAfghanistanAfricaAlbaniaArgentinaArmeniaAsiaAustraliaAustriaBahamasBangladeshBarbadosBelarusBelgiumBelizeBoliviaBosnia and HerzegovinaBrazilBulgariaBurma/MyanmarCabo VerdeCambodiaCameroonCanadaCaribbeanCentral AmericaChileChinaColombiaCongoCosta RicaCroatiaCubaCzechoslovakiaDenmarkDominicaDominican RepublicEastern AfricaEastern AsiaEastern EuropeEcuadorEgyptEl SalvadorEnglandEritreaEthiopiaEuropeFijiFranceGermanyGhanaGreeceGrenadaGuatemalaGuyanaHaitiHondurasHong KongHungaryIndiaIndonesiaIranIraqIrelandIsraelItalyJamaicaJapanJordanKazakhstanKenyaKoreaKuwaitLaosLatin AmericaLatviaLebanonLiberiaLithuaniaMalaysiaMexicoMicronesiaMiddle AfricaMoldovaMoroccoNepalNetherlandsNicaraguaNigeriaNorth AmericaNorth MacedoniaNorthern AfricaNorthern EuropeNorwayOceaniaPakistanPanamaPeruPhilippinesPolandPortugalRomaniaRussiaSaudi ArabiaScotlandSenegalSerbiaSierra LeoneSingaporeSomaliaSouth AfricaSouth AmericaSouth Central AsiaSouth Eastern AsiaSouthern EuropeSpainSri LankaSt. Vincent and the GrenadinesSudanSwedenSwitzerlandSyriaTaiwanThailandTrinidad and TobagoTurkeyUgandaUkraineUruguayUzbekistanVenezuelaVietnamWest IndiesWestern AfricaWestern AsiaWestern EuropeYemenZaireZimbabweAzores
Single Father Poverty
Income
Poverty
Unemployment
Labor Participation
Family Structure
Vehicle Availability
Education Level
Disability

Single Father Poverty Comparison

Hungarians

Immigrants from Syria

Tragic
Excellent
18.5%
SINGLE FATHER POVERTY
0.0/ 100
METRIC RATING
301st/ 347
METRIC RANK
15.9%
SINGLE FATHER POVERTY
89.5/ 100
METRIC RATING
133rd/ 347
METRIC RANK

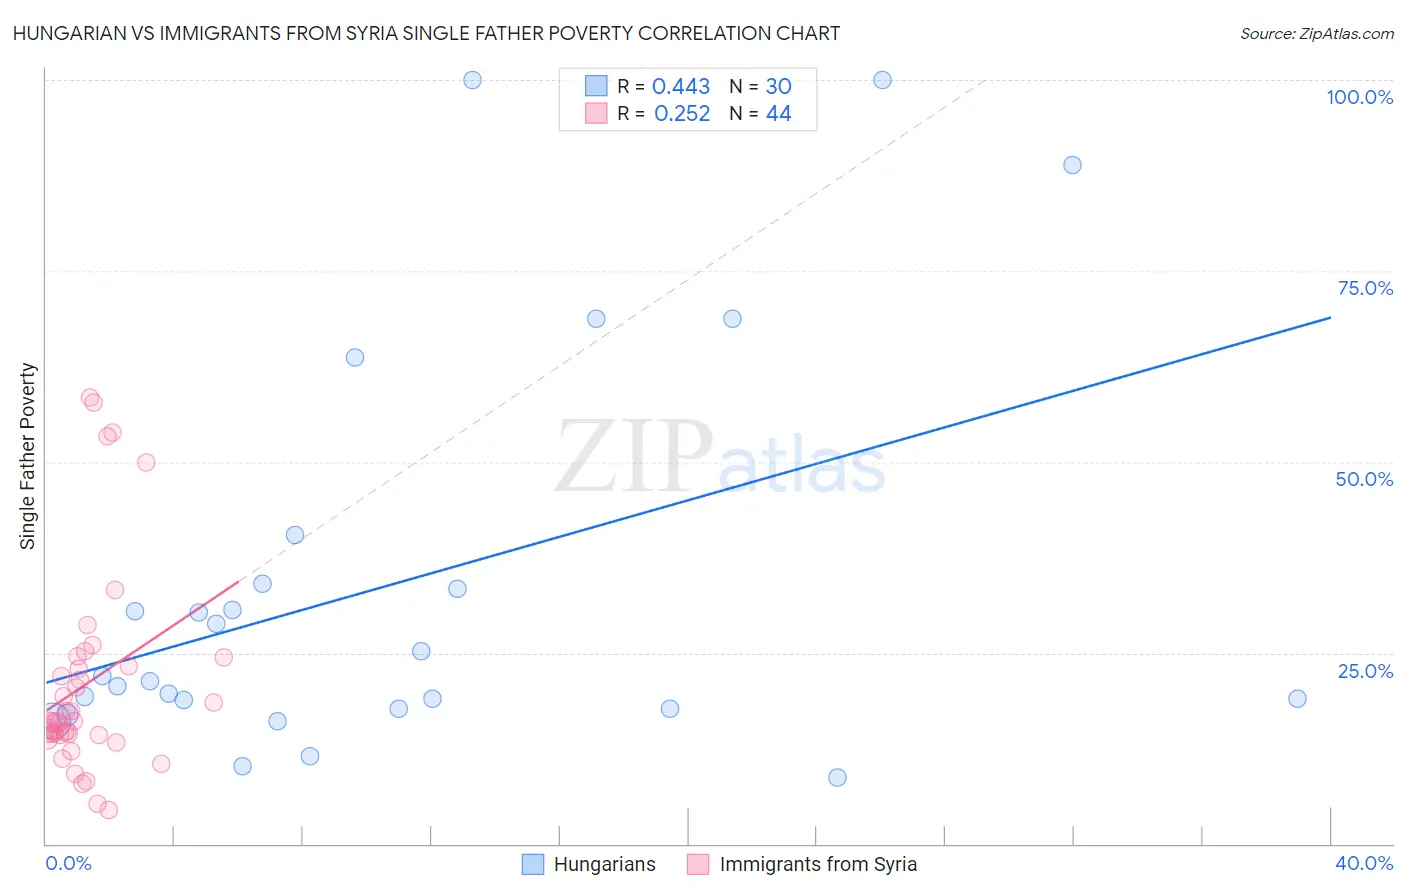
Hungarian vs Immigrants from Syria Single Father Poverty Correlation Chart

The statistical analysis conducted on geographies consisting of 362,286,644 people shows a moderate positive correlation between the proportion of Hungarians and poverty level among single fathers in the United States with a correlation coefficient (R) of 0.443 and weighted average of 18.5%. Similarly, the statistical analysis conducted on geographies consisting of 149,904,118 people shows a weak positive correlation between the proportion of Immigrants from Syria and poverty level among single fathers in the United States with a correlation coefficient (R) of 0.252 and weighted average of 15.9%, a difference of 16.0%.
Hungarian vs Immigrants from Syria Single Father Poverty

Single Father Poverty Correlation Summary

MeasurementHungarianImmigrants from Syria
Minimum8.6%4.4%
Maximum100.0%58.5%
Range91.4%54.1%
Mean33.9%21.0%
Median21.6%16.0%
Interquartile 25% (IQ1)17.7%14.3%
Interquartile 75% (IQ3)34.0%23.8%
Interquartile Range (IQR)16.3%9.5%
Standard Deviation (Sample)26.2%13.6%
Standard Deviation (Population)25.8%13.4%

Similar Demographics by Single Father Poverty

Demographics Similar to Hungarians by Single Father Poverty

In terms of single father poverty, the demographic groups most similar to Hungarians are Comanche (18.5%, a difference of 0.11%), Celtic (18.5%, a difference of 0.15%), Immigrants from Dominican Republic (18.4%, a difference of 0.22%), Ute (18.5%, a difference of 0.29%), and Blackfeet (18.5%, a difference of 0.34%).
DemographicsRating | RankSingle Father Poverty
U.S. Virgin Islanders
0.0
/100
|
#294
Tragic
18.1%
Yakama
0.0
/100
|
#295
Tragic
18.1%
Seminole
0.0
/100
|
#296
Tragic
18.1%
French
0.0
/100
|
#297
Tragic
18.2%
Africans
0.0
/100
|
#298
Tragic
18.3%
Whites/Caucasians
0.0
/100
|
#299
Tragic
18.4%
Immigrants | Dominican Republic
0.0
/100
|
#300
Tragic
18.4%
Hungarians
0.0
/100
|
#301
Tragic
18.5%
Comanche
0.0
/100
|
#302
Tragic
18.5%
Celtics
0.0
/100
|
#303
Tragic
18.5%
Ute
0.0
/100
|
#304
Tragic
18.5%
Blackfeet
0.0
/100
|
#305
Tragic
18.5%
Scotch-Irish
0.0
/100
|
#306
Tragic
18.6%
French Canadians
0.0
/100
|
#307
Tragic
18.6%
Ottawa
0.0
/100
|
#308
Tragic
18.6%

Demographics Similar to Immigrants from Syria by Single Father Poverty

In terms of single father poverty, the demographic groups most similar to Immigrants from Syria are Immigrants from Portugal (15.9%, a difference of 0.020%), Nicaraguan (15.9%, a difference of 0.070%), Norwegian (15.9%, a difference of 0.080%), Immigrants from South America (15.9%, a difference of 0.12%), and Immigrants from Sri Lanka (15.9%, a difference of 0.15%).
DemographicsRating | RankSingle Father Poverty
Hmong
91.1
/100
|
#126
Exceptional
15.9%
Immigrants | Liberia
91.1
/100
|
#127
Exceptional
15.9%
Immigrants | Nigeria
90.8
/100
|
#128
Exceptional
15.9%
Immigrants | West Indies
90.8
/100
|
#129
Exceptional
15.9%
Norwegians
90.2
/100
|
#130
Exceptional
15.9%
Nicaraguans
90.1
/100
|
#131
Exceptional
15.9%
Immigrants | Portugal
89.7
/100
|
#132
Excellent
15.9%
Immigrants | Syria
89.5
/100
|
#133
Excellent
15.9%
Immigrants | South America
88.5
/100
|
#134
Excellent
15.9%
Immigrants | Sri Lanka
88.2
/100
|
#135
Excellent
15.9%
Cypriots
87.5
/100
|
#136
Excellent
15.9%
Immigrants | Azores
87.2
/100
|
#137
Excellent
15.9%
Central Americans
87.1
/100
|
#138
Excellent
16.0%
South Americans
85.9
/100
|
#139
Excellent
16.0%
Immigrants | Netherlands
85.3
/100
|
#140
Excellent
16.0%