Immigrants from Burma/Myanmar vs Immigrants from Syria Family Households
COMPARE
Immigrants from Burma/Myanmar
Immigrants from Syria
Family Households
Family Households Comparison
Immigrants from Burma/Myanmar
Immigrants from Syria
62.6%
FAMILY HOUSEHOLDS
0.0/ 100
METRIC RATING
292nd/ 347
METRIC RANK
65.2%
FAMILY HOUSEHOLDS
98.4/ 100
METRIC RATING
98th/ 347
METRIC RANK
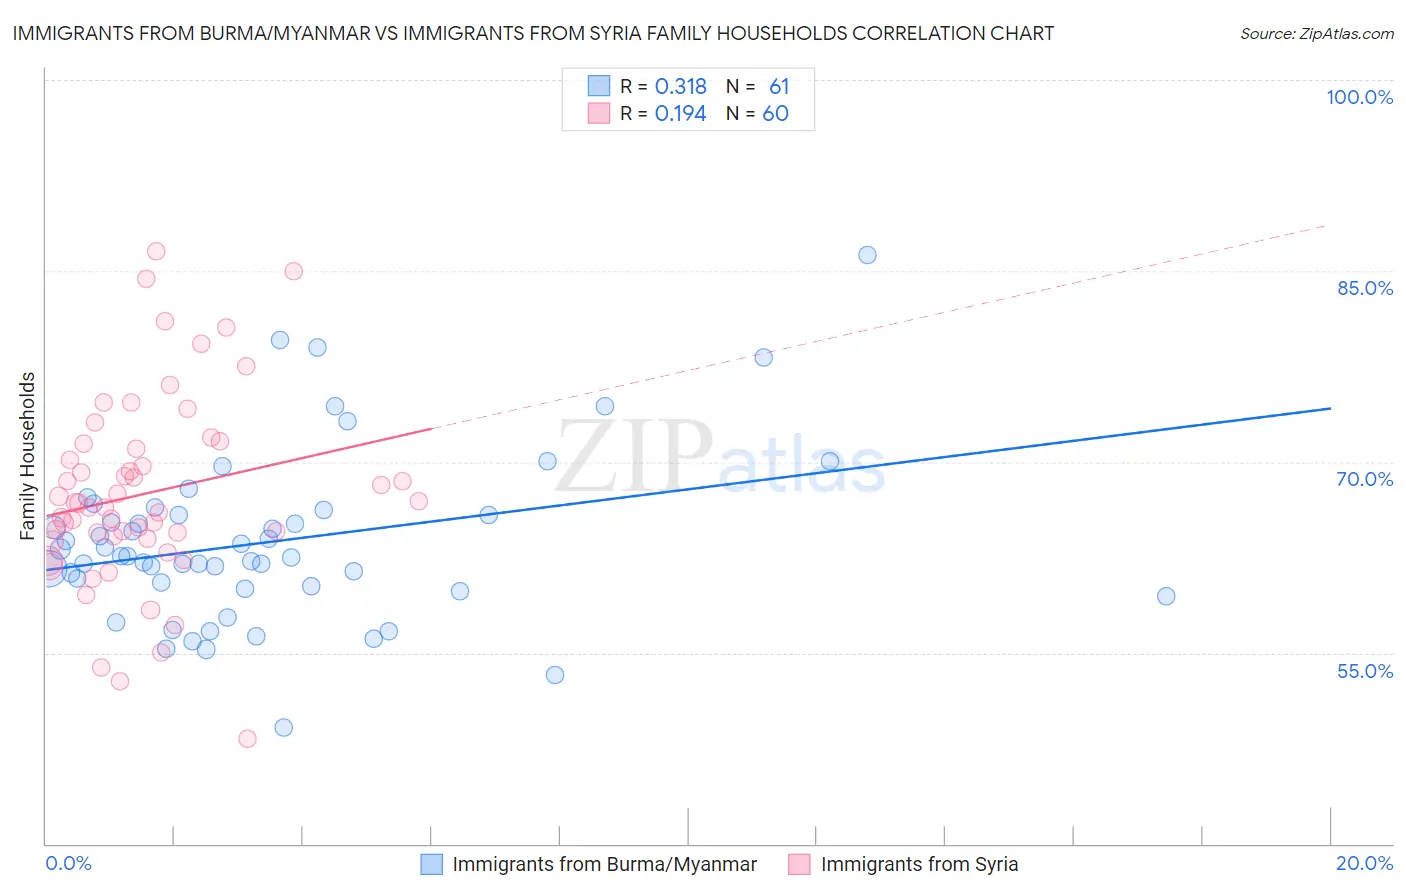
Immigrants from Burma/Myanmar vs Immigrants from Syria Family Households Correlation Chart
The statistical analysis conducted on geographies consisting of 172,273,179 people shows a mild positive correlation between the proportion of Immigrants from Burma/Myanmar and percentage of family households in the United States with a correlation coefficient (R) of 0.318 and weighted average of 62.6%. Similarly, the statistical analysis conducted on geographies consisting of 174,105,874 people shows a poor positive correlation between the proportion of Immigrants from Syria and percentage of family households in the United States with a correlation coefficient (R) of 0.194 and weighted average of 65.2%, a difference of 4.2%.
Family Households Correlation Summary
| Measurement | Immigrants from Burma/Myanmar | Immigrants from Syria |
| Minimum | 49.1% | 48.3% |
| Maximum | 86.2% | 86.5% |
| Range | 37.1% | 38.3% |
| Mean | 63.7% | 67.5% |
| Median | 62.5% | 66.6% |
| Interquartile 25% (IQ1) | 60.1% | 64.0% |
| Interquartile 75% (IQ3) | 66.0% | 71.2% |
| Interquartile Range (IQR) | 5.9% | 7.2% |
| Standard Deviation (Sample) | 6.7% | 7.6% |
| Standard Deviation (Population) | 6.6% | 7.5% |
Similar Demographics by Family Households
Demographics Similar to Immigrants from Burma/Myanmar by Family Households
In terms of family households, the demographic groups most similar to Immigrants from Burma/Myanmar are U.S. Virgin Islander (62.6%, a difference of 0.050%), Immigrants from Grenada (62.6%, a difference of 0.10%), Immigrants from Sweden (62.5%, a difference of 0.13%), Immigrants from Nepal (62.7%, a difference of 0.18%), and Barbadian (62.5%, a difference of 0.19%).
| Demographics | Rating | Rank | Family Households |
| Mongolians | 0.1 /100 | #285 | Tragic 62.8% |
| British West Indians | 0.1 /100 | #286 | Tragic 62.8% |
| Latvians | 0.1 /100 | #287 | Tragic 62.8% |
| Immigrants | Uganda | 0.1 /100 | #288 | Tragic 62.7% |
| Immigrants | Nepal | 0.1 /100 | #289 | Tragic 62.7% |
| Immigrants | Grenada | 0.0 /100 | #290 | Tragic 62.6% |
| U.S. Virgin Islanders | 0.0 /100 | #291 | Tragic 62.6% |
| Immigrants | Burma/Myanmar | 0.0 /100 | #292 | Tragic 62.6% |
| Immigrants | Sweden | 0.0 /100 | #293 | Tragic 62.5% |
| Barbadians | 0.0 /100 | #294 | Tragic 62.5% |
| Okinawans | 0.0 /100 | #295 | Tragic 62.5% |
| Slovenes | 0.0 /100 | #296 | Tragic 62.4% |
| French American Indians | 0.0 /100 | #297 | Tragic 62.4% |
| Immigrants | Spain | 0.0 /100 | #298 | Tragic 62.4% |
| Immigrants | Kuwait | 0.0 /100 | #299 | Tragic 62.4% |
Demographics Similar to Immigrants from Syria by Family Households
In terms of family households, the demographic groups most similar to Immigrants from Syria are Central American Indian (65.2%, a difference of 0.020%), Swiss (65.2%, a difference of 0.040%), Guatemalan (65.2%, a difference of 0.040%), Immigrants from Portugal (65.2%, a difference of 0.050%), and Haitian (65.2%, a difference of 0.060%).
| Demographics | Rating | Rank | Family Households |
| Crow | 98.9 /100 | #91 | Exceptional 65.3% |
| Hopi | 98.8 /100 | #92 | Exceptional 65.3% |
| Guyanese | 98.8 /100 | #93 | Exceptional 65.3% |
| Immigrants | Poland | 98.7 /100 | #94 | Exceptional 65.2% |
| Immigrants | Portugal | 98.6 /100 | #95 | Exceptional 65.2% |
| Swiss | 98.6 /100 | #96 | Exceptional 65.2% |
| Guatemalans | 98.6 /100 | #97 | Exceptional 65.2% |
| Immigrants | Syria | 98.4 /100 | #98 | Exceptional 65.2% |
| Central American Indians | 98.3 /100 | #99 | Exceptional 65.2% |
| Haitians | 98.1 /100 | #100 | Exceptional 65.2% |
| Chileans | 98.1 /100 | #101 | Exceptional 65.2% |
| Immigrants | Sri Lanka | 98.0 /100 | #102 | Exceptional 65.1% |
| Indians (Asian) | 97.9 /100 | #103 | Exceptional 65.1% |
| Spaniards | 97.8 /100 | #104 | Exceptional 65.1% |
| English | 97.4 /100 | #105 | Exceptional 65.1% |