Hungarian vs Bermudan Family Households
COMPARE
Hungarian
Bermudan
Family Households
Family Households Comparison
Hungarians
Bermudans
64.9%
FAMILY HOUSEHOLDS
94.0/ 100
METRIC RATING
121st/ 347
METRIC RANK
62.2%
FAMILY HOUSEHOLDS
0.0/ 100
METRIC RATING
305th/ 347
METRIC RANK
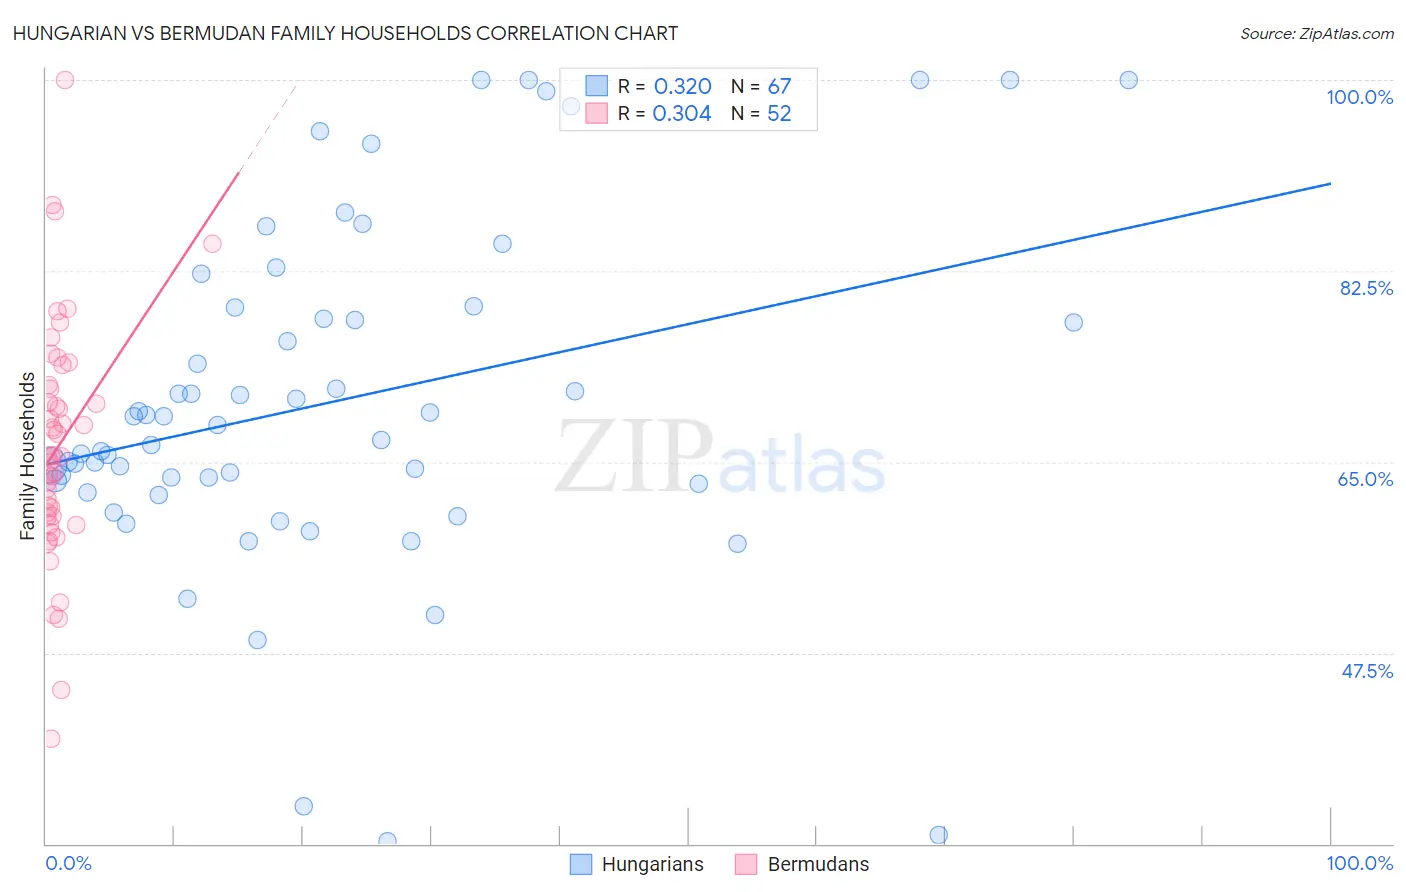
Hungarian vs Bermudan Family Households Correlation Chart
The statistical analysis conducted on geographies consisting of 485,906,921 people shows a mild positive correlation between the proportion of Hungarians and percentage of family households in the United States with a correlation coefficient (R) of 0.320 and weighted average of 64.9%. Similarly, the statistical analysis conducted on geographies consisting of 55,716,623 people shows a mild positive correlation between the proportion of Bermudans and percentage of family households in the United States with a correlation coefficient (R) of 0.304 and weighted average of 62.2%, a difference of 4.4%.
Family Households Correlation Summary
| Measurement | Hungarian | Bermudan |
| Minimum | 30.2% | 39.6% |
| Maximum | 100.0% | 100.0% |
| Range | 69.8% | 60.4% |
| Mean | 70.5% | 66.5% |
| Median | 68.4% | 65.5% |
| Interquartile 25% (IQ1) | 63.0% | 59.9% |
| Interquartile 75% (IQ3) | 79.1% | 71.8% |
| Interquartile Range (IQR) | 16.1% | 11.9% |
| Standard Deviation (Sample) | 15.7% | 10.9% |
| Standard Deviation (Population) | 15.6% | 10.8% |
Similar Demographics by Family Households
Demographics Similar to Hungarians by Family Households
In terms of family households, the demographic groups most similar to Hungarians are Immigrants from Oceania (64.9%, a difference of 0.010%), Immigrants from Eastern Asia (64.9%, a difference of 0.020%), Hmong (64.9%, a difference of 0.040%), Choctaw (64.9%, a difference of 0.040%), and Immigrants from Argentina (64.9%, a difference of 0.060%).
| Demographics | Rating | Rank | Family Households |
| Argentineans | 95.7 /100 | #114 | Exceptional 65.0% |
| Ecuadorians | 95.4 /100 | #115 | Exceptional 65.0% |
| Immigrants | Iraq | 95.4 /100 | #116 | Exceptional 65.0% |
| Cherokee | 95.3 /100 | #117 | Exceptional 65.0% |
| Dutch | 95.1 /100 | #118 | Exceptional 64.9% |
| Immigrants | Eastern Asia | 94.4 /100 | #119 | Exceptional 64.9% |
| Immigrants | Oceania | 94.2 /100 | #120 | Exceptional 64.9% |
| Hungarians | 94.0 /100 | #121 | Exceptional 64.9% |
| Hmong | 93.4 /100 | #122 | Exceptional 64.9% |
| Choctaw | 93.4 /100 | #123 | Exceptional 64.9% |
| Immigrants | Argentina | 92.8 /100 | #124 | Exceptional 64.9% |
| Immigrants | Belize | 92.7 /100 | #125 | Exceptional 64.9% |
| Panamanians | 92.4 /100 | #126 | Exceptional 64.8% |
| Immigrants | Panama | 92.0 /100 | #127 | Exceptional 64.8% |
| Italians | 91.9 /100 | #128 | Exceptional 64.8% |
Demographics Similar to Bermudans by Family Households
In terms of family households, the demographic groups most similar to Bermudans are African (62.1%, a difference of 0.020%), Immigrants from Norway (62.1%, a difference of 0.10%), Chippewa (62.1%, a difference of 0.10%), Iroquois (62.2%, a difference of 0.15%), and Subsaharan African (62.1%, a difference of 0.16%).
| Demographics | Rating | Rank | Family Households |
| Immigrants | Spain | 0.0 /100 | #298 | Tragic 62.4% |
| Immigrants | Kuwait | 0.0 /100 | #299 | Tragic 62.4% |
| Immigrants | Africa | 0.0 /100 | #300 | Tragic 62.4% |
| Immigrants | Albania | 0.0 /100 | #301 | Tragic 62.4% |
| Immigrants | Kenya | 0.0 /100 | #302 | Tragic 62.3% |
| Cree | 0.0 /100 | #303 | Tragic 62.3% |
| Iroquois | 0.0 /100 | #304 | Tragic 62.2% |
| Bermudans | 0.0 /100 | #305 | Tragic 62.2% |
| Africans | 0.0 /100 | #306 | Tragic 62.1% |
| Immigrants | Norway | 0.0 /100 | #307 | Tragic 62.1% |
| Chippewa | 0.0 /100 | #308 | Tragic 62.1% |
| Sub-Saharan Africans | 0.0 /100 | #309 | Tragic 62.1% |
| Immigrants | Liberia | 0.0 /100 | #310 | Tragic 62.0% |
| Immigrants | Morocco | 0.0 /100 | #311 | Tragic 62.0% |
| Immigrants | Latvia | 0.0 /100 | #312 | Tragic 62.0% |