Ethiopian vs Immigrants from Guyana Per Capita Income
COMPARE
Ethiopian
Immigrants from Guyana
Per Capita Income
Per Capita Income Comparison
Ethiopians
Immigrants from Guyana
$46,569
PER CAPITA INCOME
96.3/ 100
METRIC RATING
106th/ 347
METRIC RANK
$40,742
PER CAPITA INCOME
3.6/ 100
METRIC RATING
235th/ 347
METRIC RANK
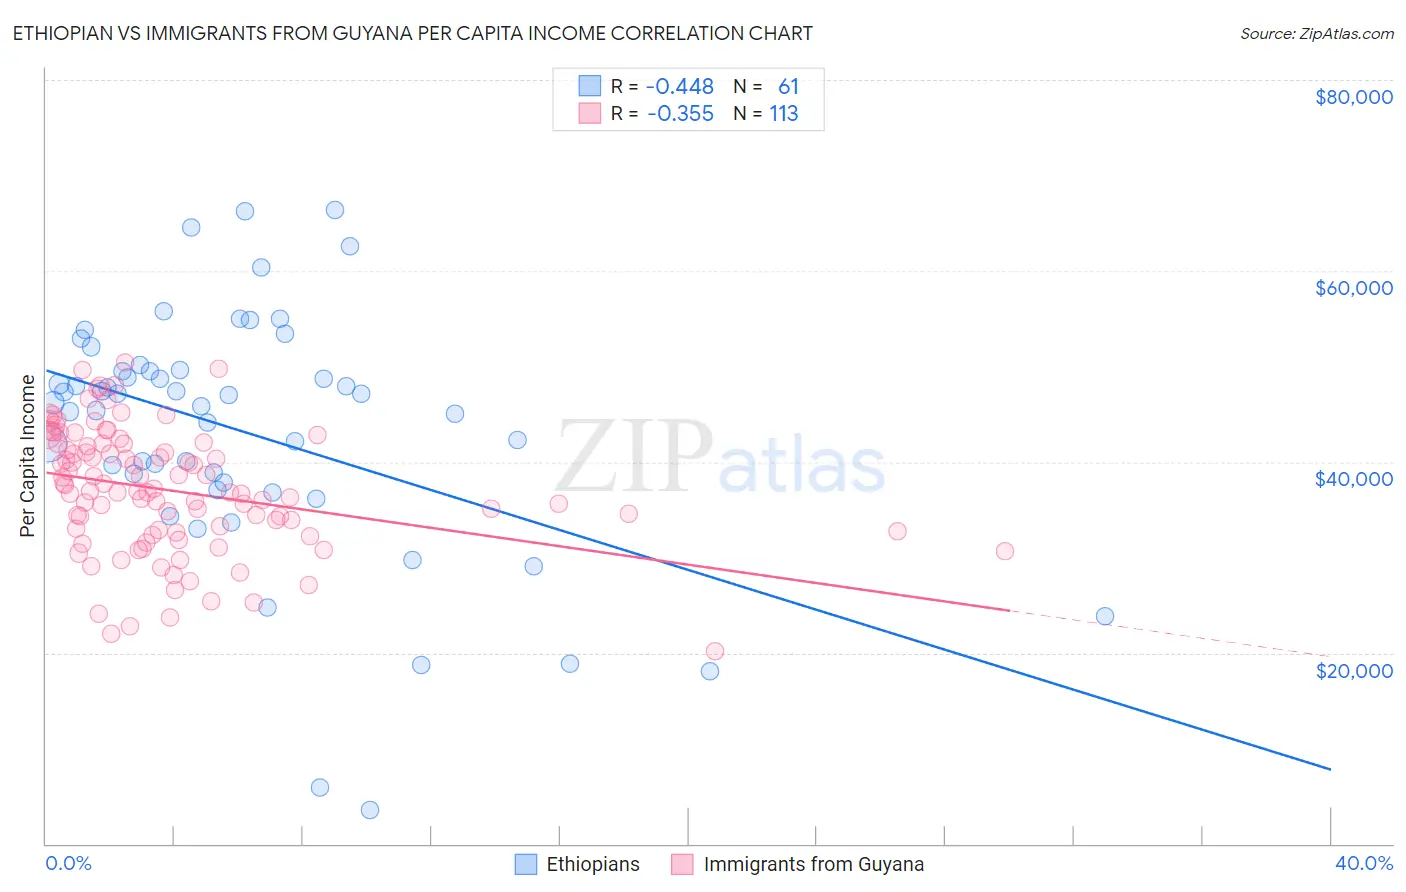
Ethiopian vs Immigrants from Guyana Per Capita Income Correlation Chart
The statistical analysis conducted on geographies consisting of 223,280,317 people shows a moderate negative correlation between the proportion of Ethiopians and per capita income in the United States with a correlation coefficient (R) of -0.448 and weighted average of $46,569. Similarly, the statistical analysis conducted on geographies consisting of 183,742,461 people shows a mild negative correlation between the proportion of Immigrants from Guyana and per capita income in the United States with a correlation coefficient (R) of -0.355 and weighted average of $40,742, a difference of 14.3%.
Per Capita Income Correlation Summary
| Measurement | Ethiopian | Immigrants from Guyana |
| Minimum | $3,511 | $20,131 |
| Maximum | $66,352 | $50,352 |
| Range | $62,841 | $30,221 |
| Mean | $43,114 | $36,982 |
| Median | $46,234 | $36,920 |
| Interquartile 25% (IQ1) | $37,442 | $32,654 |
| Interquartile 75% (IQ3) | $49,561 | $41,898 |
| Interquartile Range (IQR) | $12,119 | $9,245 |
| Standard Deviation (Sample) | $12,938 | $6,465 |
| Standard Deviation (Population) | $12,832 | $6,436 |
Similar Demographics by Per Capita Income
Demographics Similar to Ethiopians by Per Capita Income
In terms of per capita income, the demographic groups most similar to Ethiopians are British ($46,571, a difference of 0.0%), Serbian ($46,551, a difference of 0.040%), Immigrants from Kuwait ($46,543, a difference of 0.060%), Immigrants from Northern Africa ($46,531, a difference of 0.080%), and Chilean ($46,459, a difference of 0.24%).
| Demographics | Rating | Rank | Per Capita Income |
| Laotians | 97.8 /100 | #99 | Exceptional $47,041 |
| Immigrants | Lebanon | 97.5 /100 | #100 | Exceptional $46,938 |
| Immigrants | Uzbekistan | 97.5 /100 | #101 | Exceptional $46,929 |
| Immigrants | Western Asia | 97.4 /100 | #102 | Exceptional $46,876 |
| Syrians | 97.2 /100 | #103 | Exceptional $46,837 |
| Brazilians | 96.8 /100 | #104 | Exceptional $46,700 |
| British | 96.3 /100 | #105 | Exceptional $46,571 |
| Ethiopians | 96.3 /100 | #106 | Exceptional $46,569 |
| Serbians | 96.2 /100 | #107 | Exceptional $46,551 |
| Immigrants | Kuwait | 96.2 /100 | #108 | Exceptional $46,543 |
| Immigrants | Northern Africa | 96.2 /100 | #109 | Exceptional $46,531 |
| Chileans | 95.9 /100 | #110 | Exceptional $46,459 |
| Taiwanese | 95.8 /100 | #111 | Exceptional $46,455 |
| Immigrants | Morocco | 95.7 /100 | #112 | Exceptional $46,430 |
| Immigrants | Albania | 95.5 /100 | #113 | Exceptional $46,387 |
Demographics Similar to Immigrants from Guyana by Per Capita Income
In terms of per capita income, the demographic groups most similar to Immigrants from Guyana are Immigrants from West Indies ($40,763, a difference of 0.050%), Delaware ($40,778, a difference of 0.090%), Nonimmigrants ($40,669, a difference of 0.18%), Guyanese ($40,949, a difference of 0.51%), and Senegalese ($41,000, a difference of 0.63%).
| Demographics | Rating | Rank | Per Capita Income |
| Immigrants | Grenada | 5.5 /100 | #228 | Tragic $41,123 |
| Nigerians | 4.9 /100 | #229 | Tragic $41,026 |
| Native Hawaiians | 4.9 /100 | #230 | Tragic $41,017 |
| Senegalese | 4.8 /100 | #231 | Tragic $41,000 |
| Guyanese | 4.5 /100 | #232 | Tragic $40,949 |
| Delaware | 3.8 /100 | #233 | Tragic $40,778 |
| Immigrants | West Indies | 3.7 /100 | #234 | Tragic $40,763 |
| Immigrants | Guyana | 3.6 /100 | #235 | Tragic $40,742 |
| Immigrants | Nonimmigrants | 3.4 /100 | #236 | Tragic $40,669 |
| Immigrants | Cambodia | 2.6 /100 | #237 | Tragic $40,434 |
| Somalis | 2.4 /100 | #238 | Tragic $40,367 |
| Tsimshian | 2.4 /100 | #239 | Tragic $40,344 |
| Immigrants | Nigeria | 2.3 /100 | #240 | Tragic $40,339 |
| British West Indians | 2.3 /100 | #241 | Tragic $40,330 |
| Immigrants | Western Africa | 2.2 /100 | #242 | Tragic $40,294 |