Choctaw vs Immigrants from Panama Married-couple Households
COMPARE
Choctaw
Immigrants from Panama
Married-couple Households
Married-couple Households Comparison
Choctaw
Immigrants from Panama
46.0%
MARRIED-COUPLE HOUSEHOLDS
24.9/ 100
METRIC RATING
191st/ 347
METRIC RANK
44.6%
MARRIED-COUPLE HOUSEHOLDS
1.3/ 100
METRIC RATING
234th/ 347
METRIC RANK
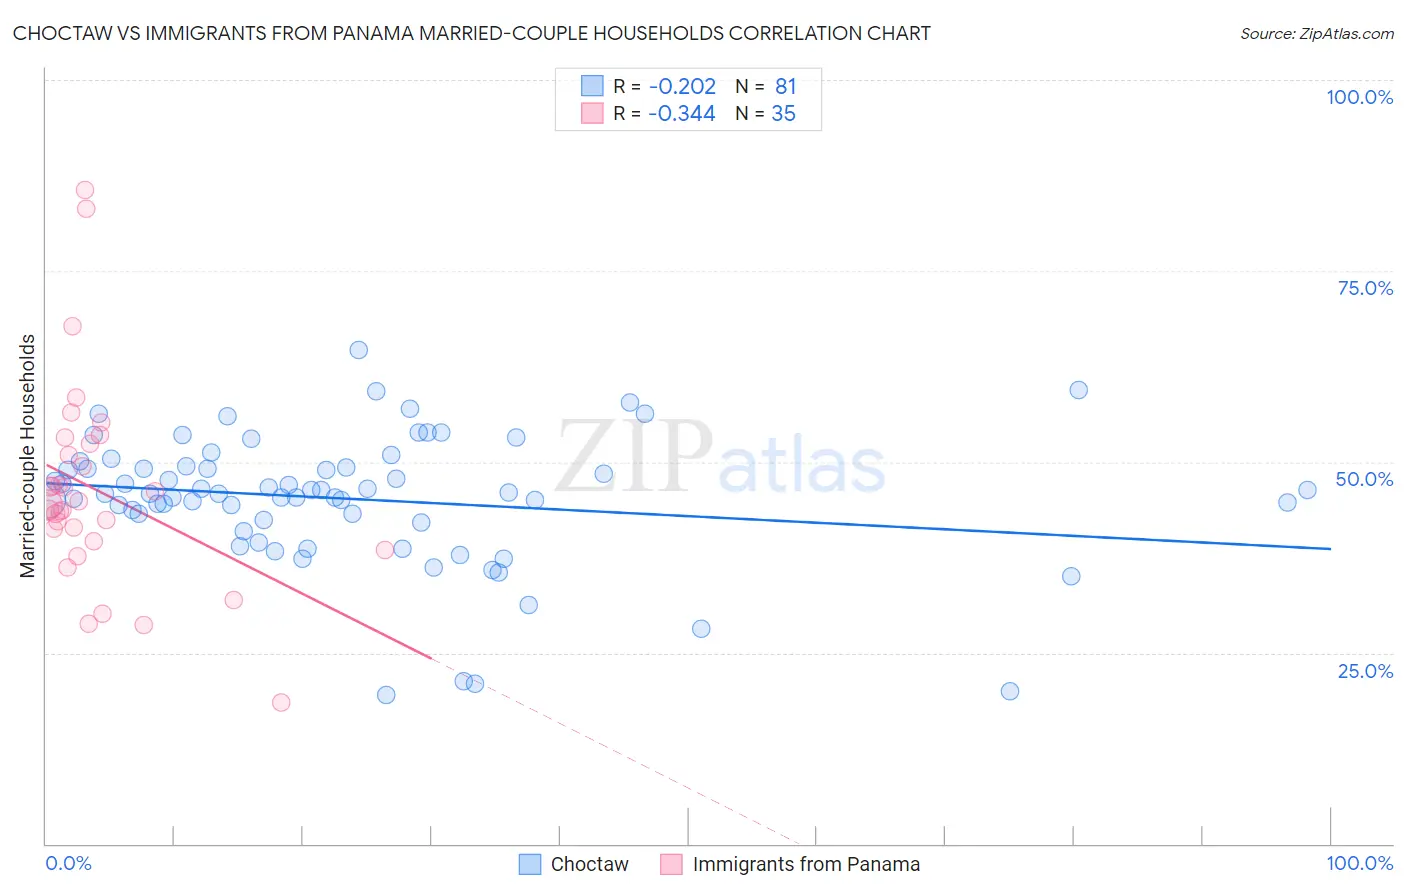
Choctaw vs Immigrants from Panama Married-couple Households Correlation Chart
The statistical analysis conducted on geographies consisting of 269,626,199 people shows a weak negative correlation between the proportion of Choctaw and percentage of married-couple family households in the United States with a correlation coefficient (R) of -0.202 and weighted average of 46.0%. Similarly, the statistical analysis conducted on geographies consisting of 221,156,465 people shows a mild negative correlation between the proportion of Immigrants from Panama and percentage of married-couple family households in the United States with a correlation coefficient (R) of -0.344 and weighted average of 44.6%, a difference of 3.2%.
Married-couple Households Correlation Summary
| Measurement | Choctaw | Immigrants from Panama |
| Minimum | 19.5% | 18.6% |
| Maximum | 64.6% | 85.7% |
| Range | 45.1% | 67.1% |
| Mean | 45.2% | 46.3% |
| Median | 45.9% | 44.4% |
| Interquartile 25% (IQ1) | 42.3% | 39.6% |
| Interquartile 75% (IQ3) | 49.4% | 52.4% |
| Interquartile Range (IQR) | 7.1% | 12.9% |
| Standard Deviation (Sample) | 8.6% | 13.4% |
| Standard Deviation (Population) | 8.6% | 13.2% |
Similar Demographics by Married-couple Households
Demographics Similar to Choctaw by Married-couple Households
In terms of married-couple households, the demographic groups most similar to Choctaw are Immigrants from Northern Africa (46.0%, a difference of 0.020%), Immigrants from Kuwait (46.0%, a difference of 0.030%), Taiwanese (45.9%, a difference of 0.080%), Mexican American Indian (45.9%, a difference of 0.080%), and Immigrants from Latvia (46.0%, a difference of 0.10%).
| Demographics | Rating | Rank | Married-couple Households |
| Immigrants | Switzerland | 36.9 /100 | #184 | Fair 46.2% |
| Brazilians | 35.9 /100 | #185 | Fair 46.2% |
| Albanians | 31.1 /100 | #186 | Fair 46.1% |
| Fijians | 29.2 /100 | #187 | Fair 46.1% |
| South American Indians | 28.4 /100 | #188 | Fair 46.0% |
| Immigrants | Latvia | 26.9 /100 | #189 | Fair 46.0% |
| Immigrants | Kuwait | 25.6 /100 | #190 | Fair 46.0% |
| Choctaw | 24.9 /100 | #191 | Fair 46.0% |
| Immigrants | Northern Africa | 24.6 /100 | #192 | Fair 46.0% |
| Taiwanese | 23.4 /100 | #193 | Fair 45.9% |
| Mexican American Indians | 23.3 /100 | #194 | Fair 45.9% |
| Chickasaw | 22.7 /100 | #195 | Fair 45.9% |
| Immigrants | South America | 22.2 /100 | #196 | Fair 45.9% |
| Cambodians | 21.3 /100 | #197 | Fair 45.9% |
| Ottawa | 19.4 /100 | #198 | Poor 45.8% |
Demographics Similar to Immigrants from Panama by Married-couple Households
In terms of married-couple households, the demographic groups most similar to Immigrants from Panama are Immigrants from Nicaragua (44.5%, a difference of 0.070%), Yaqui (44.5%, a difference of 0.080%), Comanche (44.5%, a difference of 0.11%), Immigrants from Uganda (44.6%, a difference of 0.12%), and Houma (44.6%, a difference of 0.16%).
| Demographics | Rating | Rank | Married-couple Households |
| Salvadorans | 1.9 /100 | #227 | Tragic 44.7% |
| Kenyans | 1.7 /100 | #228 | Tragic 44.7% |
| Immigrants | Latin America | 1.6 /100 | #229 | Tragic 44.7% |
| Soviet Union | 1.6 /100 | #230 | Tragic 44.6% |
| Houma | 1.5 /100 | #231 | Tragic 44.6% |
| Marshallese | 1.5 /100 | #232 | Tragic 44.6% |
| Immigrants | Uganda | 1.5 /100 | #233 | Tragic 44.6% |
| Immigrants | Panama | 1.3 /100 | #234 | Tragic 44.6% |
| Immigrants | Nicaragua | 1.2 /100 | #235 | Tragic 44.5% |
| Yaqui | 1.2 /100 | #236 | Tragic 44.5% |
| Comanche | 1.2 /100 | #237 | Tragic 44.5% |
| Immigrants | Uruguay | 1.1 /100 | #238 | Tragic 44.5% |
| Spanish Americans | 1.1 /100 | #239 | Tragic 44.5% |
| Ute | 1.0 /100 | #240 | Tragic 44.4% |
| Immigrants | Bosnia and Herzegovina | 1.0 /100 | #241 | Tragic 44.4% |