Choctaw vs Immigrants from Panama Unemployment Among Ages 20 to 24 years
COMPARE
Choctaw
Immigrants from Panama
Unemployment Among Ages 20 to 24 years
Unemployment Among Ages 20 to 24 years Comparison
Choctaw
Immigrants from Panama
10.6%
UNEMPLOYMENT AMONG AGES 20 TO 24 YEARS
3.6/ 100
METRIC RATING
233rd/ 347
METRIC RANK
10.8%
UNEMPLOYMENT AMONG AGES 20 TO 24 YEARS
0.4/ 100
METRIC RATING
251st/ 347
METRIC RANK
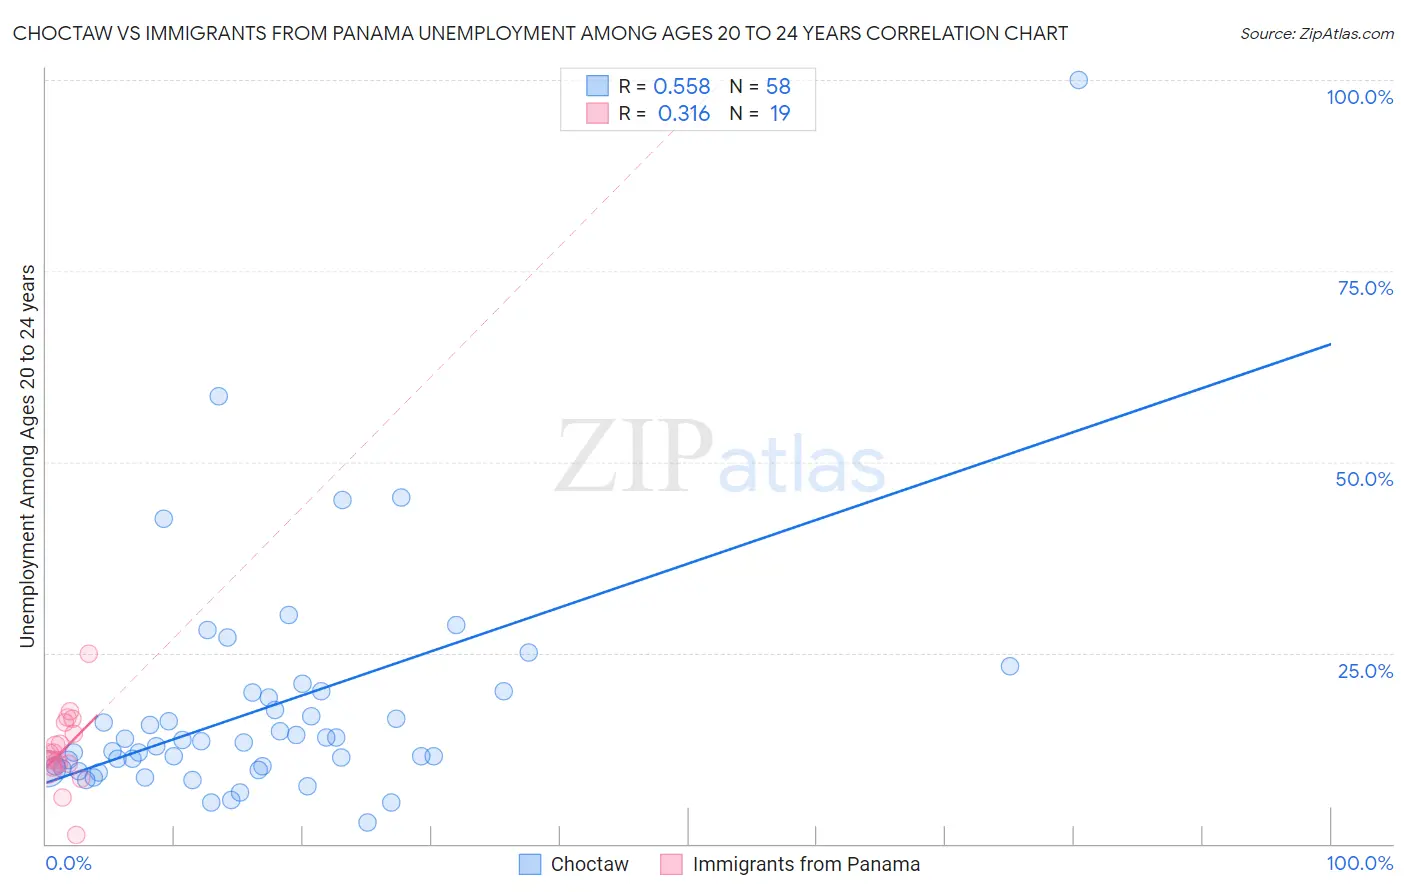
Choctaw vs Immigrants from Panama Unemployment Among Ages 20 to 24 years Correlation Chart
The statistical analysis conducted on geographies consisting of 261,469,293 people shows a substantial positive correlation between the proportion of Choctaw and unemployment rate among population between the ages 20 and 24 in the United States with a correlation coefficient (R) of 0.558 and weighted average of 10.6%. Similarly, the statistical analysis conducted on geographies consisting of 218,334,503 people shows a mild positive correlation between the proportion of Immigrants from Panama and unemployment rate among population between the ages 20 and 24 in the United States with a correlation coefficient (R) of 0.316 and weighted average of 10.8%, a difference of 1.9%.
Unemployment Among Ages 20 to 24 years Correlation Summary
| Measurement | Choctaw | Immigrants from Panama |
| Minimum | 2.8% | 1.2% |
| Maximum | 100.0% | 24.9% |
| Range | 97.2% | 23.7% |
| Mean | 17.7% | 12.3% |
| Median | 13.3% | 11.7% |
| Interquartile 25% (IQ1) | 9.9% | 10.0% |
| Interquartile 75% (IQ3) | 19.8% | 15.9% |
| Interquartile Range (IQR) | 9.9% | 5.9% |
| Standard Deviation (Sample) | 15.3% | 4.9% |
| Standard Deviation (Population) | 15.2% | 4.8% |
Demographics Similar to Choctaw and Immigrants from Panama by Unemployment Among Ages 20 to 24 years
In terms of unemployment among ages 20 to 24 years, the demographic groups most similar to Choctaw are Immigrants from Africa (10.6%, a difference of 0.010%), Israeli (10.6%, a difference of 0.020%), Immigrants from Ukraine (10.6%, a difference of 0.060%), Mexican (10.6%, a difference of 0.11%), and Immigrants (10.6%, a difference of 0.27%). Similarly, the demographic groups most similar to Immigrants from Panama are Albanian (10.8%, a difference of 0.060%), Immigrants from Syria (10.8%, a difference of 0.060%), South American Indian (10.8%, a difference of 0.10%), Cree (10.8%, a difference of 0.30%), and Immigrants from Albania (10.8%, a difference of 0.40%).
| Demographics | Rating | Rank | Unemployment Among Ages 20 to 24 years |
| Israelis | 3.7 /100 | #232 | Tragic 10.6% |
| Choctaw | 3.6 /100 | #233 | Tragic 10.6% |
| Immigrants | Africa | 3.5 /100 | #234 | Tragic 10.6% |
| Immigrants | Ukraine | 3.3 /100 | #235 | Tragic 10.6% |
| Mexicans | 3.2 /100 | #236 | Tragic 10.6% |
| Immigrants | Immigrants | 2.7 /100 | #237 | Tragic 10.6% |
| Immigrants | Pakistan | 2.6 /100 | #238 | Tragic 10.6% |
| Salvadorans | 2.4 /100 | #239 | Tragic 10.7% |
| Immigrants | Central America | 2.0 /100 | #240 | Tragic 10.7% |
| Immigrants | El Salvador | 1.7 /100 | #241 | Tragic 10.7% |
| Moroccans | 1.4 /100 | #242 | Tragic 10.7% |
| Immigrants | Belarus | 1.3 /100 | #243 | Tragic 10.7% |
| Immigrants | Mexico | 1.2 /100 | #244 | Tragic 10.7% |
| Hispanics or Latinos | 1.0 /100 | #245 | Tragic 10.7% |
| Immigrants | Iran | 0.9 /100 | #246 | Tragic 10.8% |
| Immigrants | Albania | 0.7 /100 | #247 | Tragic 10.8% |
| Cree | 0.6 /100 | #248 | Tragic 10.8% |
| South American Indians | 0.5 /100 | #249 | Tragic 10.8% |
| Albanians | 0.5 /100 | #250 | Tragic 10.8% |
| Immigrants | Panama | 0.4 /100 | #251 | Tragic 10.8% |
| Immigrants | Syria | 0.4 /100 | #252 | Tragic 10.8% |