Barbadian vs Celtic Family Households
COMPARE
Barbadian
Celtic
Family Households
Family Households Comparison
Barbadians
Celtics
62.5%
FAMILY HOUSEHOLDS
0.0/ 100
METRIC RATING
294th/ 347
METRIC RANK
63.8%
FAMILY HOUSEHOLDS
8.0/ 100
METRIC RATING
214th/ 347
METRIC RANK
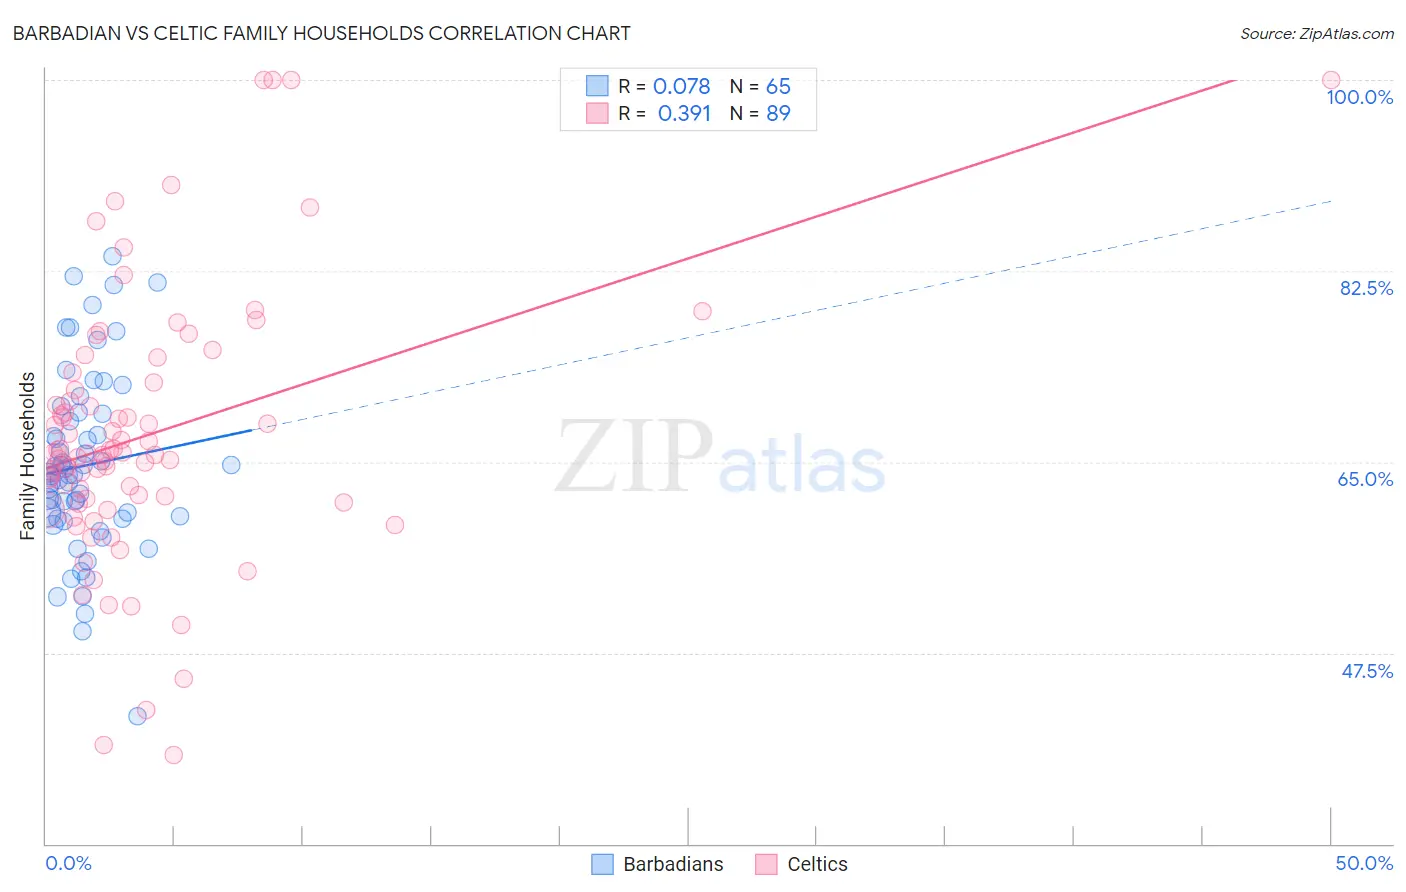
Barbadian vs Celtic Family Households Correlation Chart
The statistical analysis conducted on geographies consisting of 141,274,787 people shows a slight positive correlation between the proportion of Barbadians and percentage of family households in the United States with a correlation coefficient (R) of 0.078 and weighted average of 62.5%. Similarly, the statistical analysis conducted on geographies consisting of 168,846,430 people shows a mild positive correlation between the proportion of Celtics and percentage of family households in the United States with a correlation coefficient (R) of 0.391 and weighted average of 63.8%, a difference of 2.1%.
Family Households Correlation Summary
| Measurement | Barbadian | Celtic |
| Minimum | 41.7% | 38.1% |
| Maximum | 83.8% | 100.0% |
| Range | 42.1% | 61.9% |
| Mean | 64.7% | 67.4% |
| Median | 63.8% | 65.8% |
| Interquartile 25% (IQ1) | 59.8% | 61.4% |
| Interquartile 75% (IQ3) | 69.5% | 71.9% |
| Interquartile Range (IQR) | 9.7% | 10.5% |
| Standard Deviation (Sample) | 8.4% | 12.1% |
| Standard Deviation (Population) | 8.3% | 12.0% |
Similar Demographics by Family Households
Demographics Similar to Barbadians by Family Households
In terms of family households, the demographic groups most similar to Barbadians are Okinawan (62.5%, a difference of 0.010%), Slovene (62.4%, a difference of 0.020%), French American Indian (62.4%, a difference of 0.040%), Immigrants from Sweden (62.5%, a difference of 0.060%), and Immigrants from Spain (62.4%, a difference of 0.060%).
| Demographics | Rating | Rank | Family Households |
| Latvians | 0.1 /100 | #287 | Tragic 62.8% |
| Immigrants | Uganda | 0.1 /100 | #288 | Tragic 62.7% |
| Immigrants | Nepal | 0.1 /100 | #289 | Tragic 62.7% |
| Immigrants | Grenada | 0.0 /100 | #290 | Tragic 62.6% |
| U.S. Virgin Islanders | 0.0 /100 | #291 | Tragic 62.6% |
| Immigrants | Burma/Myanmar | 0.0 /100 | #292 | Tragic 62.6% |
| Immigrants | Sweden | 0.0 /100 | #293 | Tragic 62.5% |
| Barbadians | 0.0 /100 | #294 | Tragic 62.5% |
| Okinawans | 0.0 /100 | #295 | Tragic 62.5% |
| Slovenes | 0.0 /100 | #296 | Tragic 62.4% |
| French American Indians | 0.0 /100 | #297 | Tragic 62.4% |
| Immigrants | Spain | 0.0 /100 | #298 | Tragic 62.4% |
| Immigrants | Kuwait | 0.0 /100 | #299 | Tragic 62.4% |
| Immigrants | Africa | 0.0 /100 | #300 | Tragic 62.4% |
| Immigrants | Albania | 0.0 /100 | #301 | Tragic 62.4% |
Demographics Similar to Celtics by Family Households
In terms of family households, the demographic groups most similar to Celtics are Belgian (63.8%, a difference of 0.020%), Croatian (63.8%, a difference of 0.030%), Immigrants from Northern Europe (63.8%, a difference of 0.040%), Osage (63.7%, a difference of 0.050%), and Marshallese (63.7%, a difference of 0.050%).
| Demographics | Rating | Rank | Family Households |
| Nigerians | 11.5 /100 | #207 | Poor 63.9% |
| Immigrants | Bangladesh | 11.4 /100 | #208 | Poor 63.9% |
| Sierra Leoneans | 11.2 /100 | #209 | Poor 63.9% |
| Immigrants | Thailand | 9.6 /100 | #210 | Tragic 63.8% |
| Shoshone | 9.4 /100 | #211 | Tragic 63.8% |
| Immigrants | Netherlands | 9.4 /100 | #212 | Tragic 63.8% |
| Immigrants | Northern Europe | 8.8 /100 | #213 | Tragic 63.8% |
| Celtics | 8.0 /100 | #214 | Tragic 63.8% |
| Belgians | 7.6 /100 | #215 | Tragic 63.8% |
| Croatians | 7.3 /100 | #216 | Tragic 63.8% |
| Osage | 7.0 /100 | #217 | Tragic 63.7% |
| Marshallese | 6.9 /100 | #218 | Tragic 63.7% |
| Macedonians | 6.5 /100 | #219 | Tragic 63.7% |
| Immigrants | Europe | 6.4 /100 | #220 | Tragic 63.7% |
| Immigrants | South Africa | 5.9 /100 | #221 | Tragic 63.7% |