Basque vs South American Indian Male Disability
COMPARE
Basque
South American Indian
Male Disability
Male Disability Comparison
Basques
South American Indians
12.1%
MALE DISABILITY
0.3/ 100
METRIC RATING
258th/ 347
METRIC RANK
10.9%
MALE DISABILITY
88.1/ 100
METRIC RATING
124th/ 347
METRIC RANK
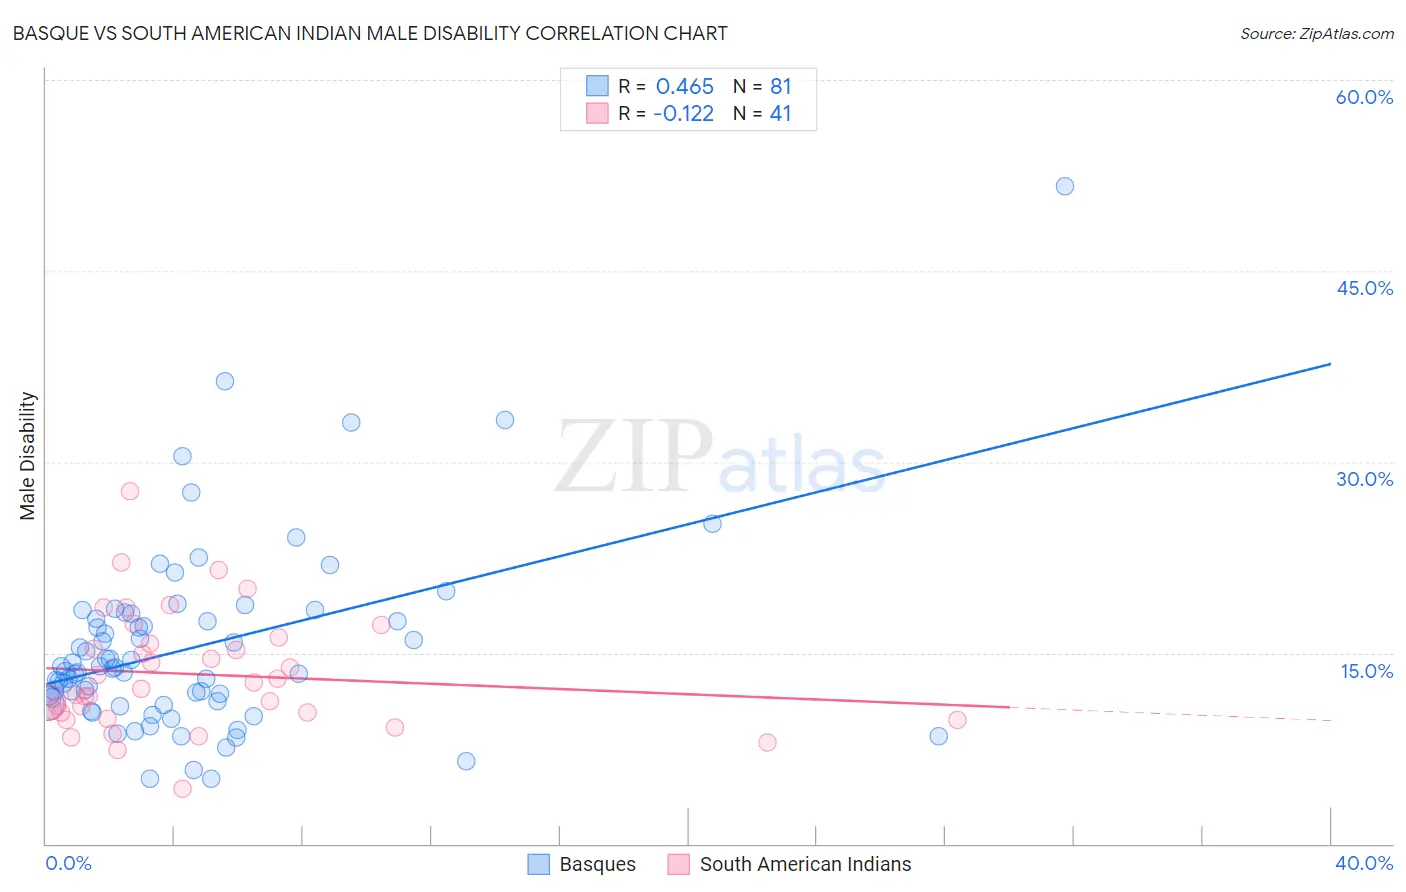
Basque vs South American Indian Male Disability Correlation Chart
The statistical analysis conducted on geographies consisting of 165,777,747 people shows a moderate positive correlation between the proportion of Basques and percentage of males with a disability in the United States with a correlation coefficient (R) of 0.465 and weighted average of 12.1%. Similarly, the statistical analysis conducted on geographies consisting of 164,560,942 people shows a poor negative correlation between the proportion of South American Indians and percentage of males with a disability in the United States with a correlation coefficient (R) of -0.122 and weighted average of 10.9%, a difference of 11.1%.
Male Disability Correlation Summary
| Measurement | Basque | South American Indian |
| Minimum | 5.1% | 4.3% |
| Maximum | 51.7% | 27.7% |
| Range | 46.6% | 23.4% |
| Mean | 15.4% | 13.3% |
| Median | 13.8% | 12.2% |
| Interquartile 25% (IQ1) | 11.1% | 10.1% |
| Interquartile 75% (IQ3) | 17.9% | 15.9% |
| Interquartile Range (IQR) | 6.7% | 5.9% |
| Standard Deviation (Sample) | 7.4% | 4.7% |
| Standard Deviation (Population) | 7.3% | 4.6% |
Similar Demographics by Male Disability
Demographics Similar to Basques by Male Disability
In terms of male disability, the demographic groups most similar to Basques are Belgian (12.1%, a difference of 0.040%), Swedish (12.1%, a difference of 0.12%), Swiss (12.1%, a difference of 0.19%), European (12.1%, a difference of 0.19%), and Chinese (12.1%, a difference of 0.44%).
| Demographics | Rating | Rank | Male Disability |
| German Russians | 0.5 /100 | #251 | Tragic 12.0% |
| Slovenes | 0.5 /100 | #252 | Tragic 12.0% |
| Guamanians/Chamorros | 0.5 /100 | #253 | Tragic 12.0% |
| British | 0.4 /100 | #254 | Tragic 12.1% |
| Chinese | 0.4 /100 | #255 | Tragic 12.1% |
| Swiss | 0.3 /100 | #256 | Tragic 12.1% |
| Europeans | 0.3 /100 | #257 | Tragic 12.1% |
| Basques | 0.3 /100 | #258 | Tragic 12.1% |
| Belgians | 0.3 /100 | #259 | Tragic 12.1% |
| Swedes | 0.3 /100 | #260 | Tragic 12.1% |
| Slavs | 0.2 /100 | #261 | Tragic 12.2% |
| Norwegians | 0.2 /100 | #262 | Tragic 12.2% |
| Canadians | 0.2 /100 | #263 | Tragic 12.2% |
| Nepalese | 0.2 /100 | #264 | Tragic 12.2% |
| Immigrants | Portugal | 0.1 /100 | #265 | Tragic 12.3% |
Demographics Similar to South American Indians by Male Disability
In terms of male disability, the demographic groups most similar to South American Indians are Immigrants from North Macedonia (10.9%, a difference of 0.0%), Immigrants from Czechoslovakia (10.9%, a difference of 0.040%), Immigrants from Ghana (10.9%, a difference of 0.14%), Immigrants from South Eastern Asia (10.9%, a difference of 0.15%), and Immigrants from Trinidad and Tobago (10.9%, a difference of 0.16%).
| Demographics | Rating | Rank | Male Disability |
| Eastern Europeans | 90.6 /100 | #117 | Exceptional 10.9% |
| Immigrants | Cuba | 90.2 /100 | #118 | Exceptional 10.9% |
| Armenians | 90.1 /100 | #119 | Exceptional 10.9% |
| Immigrants | Africa | 89.4 /100 | #120 | Excellent 10.9% |
| Immigrants | South Eastern Asia | 89.2 /100 | #121 | Excellent 10.9% |
| Immigrants | Ghana | 89.0 /100 | #122 | Excellent 10.9% |
| Immigrants | Czechoslovakia | 88.4 /100 | #123 | Excellent 10.9% |
| South American Indians | 88.1 /100 | #124 | Excellent 10.9% |
| Immigrants | North Macedonia | 88.1 /100 | #125 | Excellent 10.9% |
| Immigrants | Trinidad and Tobago | 86.9 /100 | #126 | Excellent 10.9% |
| Immigrants | Ukraine | 86.8 /100 | #127 | Excellent 10.9% |
| Immigrants | Latvia | 85.5 /100 | #128 | Excellent 10.9% |
| Immigrants | Philippines | 85.4 /100 | #129 | Excellent 10.9% |
| Brazilians | 85.4 /100 | #130 | Excellent 10.9% |
| Macedonians | 84.2 /100 | #131 | Excellent 11.0% |