Zimbabwean vs Immigrants from Burma/Myanmar Ambulatory Disability
COMPARE
Zimbabwean
Immigrants from Burma/Myanmar
Ambulatory Disability
Ambulatory Disability Comparison
Zimbabweans
Immigrants from Burma/Myanmar
5.4%
AMBULATORY DISABILITY
100.0/ 100
METRIC RATING
25th/ 347
METRIC RANK
6.1%
AMBULATORY DISABILITY
52.2/ 100
METRIC RATING
172nd/ 347
METRIC RANK
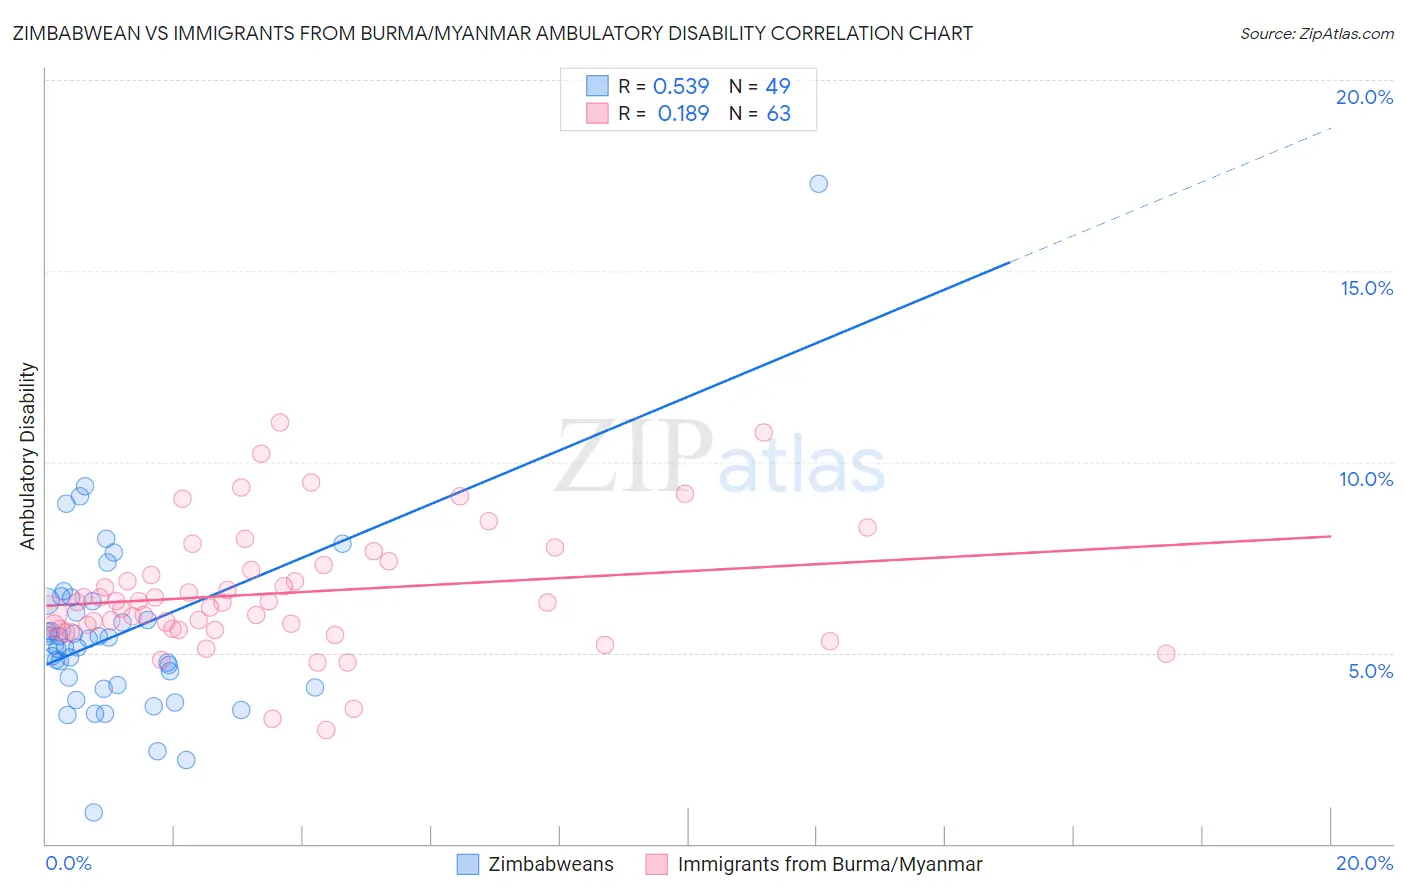
Zimbabwean vs Immigrants from Burma/Myanmar Ambulatory Disability Correlation Chart
The statistical analysis conducted on geographies consisting of 69,187,176 people shows a substantial positive correlation between the proportion of Zimbabweans and percentage of population with ambulatory disability in the United States with a correlation coefficient (R) of 0.539 and weighted average of 5.4%. Similarly, the statistical analysis conducted on geographies consisting of 172,292,594 people shows a poor positive correlation between the proportion of Immigrants from Burma/Myanmar and percentage of population with ambulatory disability in the United States with a correlation coefficient (R) of 0.189 and weighted average of 6.1%, a difference of 13.3%.
Ambulatory Disability Correlation Summary
| Measurement | Zimbabwean | Immigrants from Burma/Myanmar |
| Minimum | 0.83% | 3.0% |
| Maximum | 17.3% | 11.0% |
| Range | 16.5% | 8.0% |
| Mean | 5.5% | 6.6% |
| Median | 5.2% | 6.3% |
| Interquartile 25% (IQ1) | 4.1% | 5.6% |
| Interquartile 75% (IQ3) | 6.4% | 7.3% |
| Interquartile Range (IQR) | 2.2% | 1.7% |
| Standard Deviation (Sample) | 2.4% | 1.6% |
| Standard Deviation (Population) | 2.4% | 1.6% |
Similar Demographics by Ambulatory Disability
Demographics Similar to Zimbabweans by Ambulatory Disability
In terms of ambulatory disability, the demographic groups most similar to Zimbabweans are Immigrants from Nepal (5.4%, a difference of 0.030%), Immigrants from Saudi Arabia (5.4%, a difference of 0.080%), Tongan (5.4%, a difference of 0.17%), Asian (5.4%, a difference of 0.19%), and Immigrants from Israel (5.4%, a difference of 0.21%).
| Demographics | Rating | Rank | Ambulatory Disability |
| Immigrants | Sri Lanka | 100.0 /100 | #18 | Exceptional 5.4% |
| Indians (Asian) | 100.0 /100 | #19 | Exceptional 5.4% |
| Ethiopians | 100.0 /100 | #20 | Exceptional 5.4% |
| Immigrants | Kuwait | 100.0 /100 | #21 | Exceptional 5.4% |
| Immigrants | Israel | 100.0 /100 | #22 | Exceptional 5.4% |
| Tongans | 100.0 /100 | #23 | Exceptional 5.4% |
| Immigrants | Saudi Arabia | 100.0 /100 | #24 | Exceptional 5.4% |
| Zimbabweans | 100.0 /100 | #25 | Exceptional 5.4% |
| Immigrants | Nepal | 100.0 /100 | #26 | Exceptional 5.4% |
| Asians | 100.0 /100 | #27 | Exceptional 5.4% |
| Cambodians | 100.0 /100 | #28 | Exceptional 5.4% |
| Immigrants | Iran | 100.0 /100 | #29 | Exceptional 5.4% |
| Immigrants | Turkey | 100.0 /100 | #30 | Exceptional 5.4% |
| Immigrants | Venezuela | 100.0 /100 | #31 | Exceptional 5.4% |
| Immigrants | Australia | 100.0 /100 | #32 | Exceptional 5.5% |
Demographics Similar to Immigrants from Burma/Myanmar by Ambulatory Disability
In terms of ambulatory disability, the demographic groups most similar to Immigrants from Burma/Myanmar are Moroccan (6.1%, a difference of 0.020%), Croatian (6.1%, a difference of 0.050%), Immigrants from Ecuador (6.1%, a difference of 0.090%), Immigrants from Canada (6.1%, a difference of 0.11%), and Vietnamese (6.1%, a difference of 0.26%).
| Demographics | Rating | Rank | Ambulatory Disability |
| Nicaraguans | 63.2 /100 | #165 | Good 6.1% |
| Iraqis | 62.8 /100 | #166 | Good 6.1% |
| Immigrants | Oceania | 60.7 /100 | #167 | Good 6.1% |
| Ecuadorians | 60.5 /100 | #168 | Good 6.1% |
| Immigrants | Southern Europe | 58.1 /100 | #169 | Average 6.1% |
| Immigrants | Ecuador | 53.8 /100 | #170 | Average 6.1% |
| Moroccans | 52.6 /100 | #171 | Average 6.1% |
| Immigrants | Burma/Myanmar | 52.2 /100 | #172 | Average 6.1% |
| Croatians | 51.2 /100 | #173 | Average 6.1% |
| Immigrants | Canada | 50.0 /100 | #174 | Average 6.1% |
| Vietnamese | 47.2 /100 | #175 | Average 6.1% |
| Immigrants | North America | 45.6 /100 | #176 | Average 6.1% |
| Immigrants | England | 45.4 /100 | #177 | Average 6.1% |
| Scandinavians | 44.5 /100 | #178 | Average 6.1% |
| Austrians | 44.1 /100 | #179 | Average 6.1% |