Yuman vs Belgian Female Disability
COMPARE
Yuman
Belgian
Female Disability
Female Disability Comparison
Yuman
Belgians
14.5%
FEMALE DISABILITY
0.0/ 100
METRIC RATING
330th/ 347
METRIC RANK
12.5%
FEMALE DISABILITY
6.5/ 100
METRIC RATING
231st/ 347
METRIC RANK
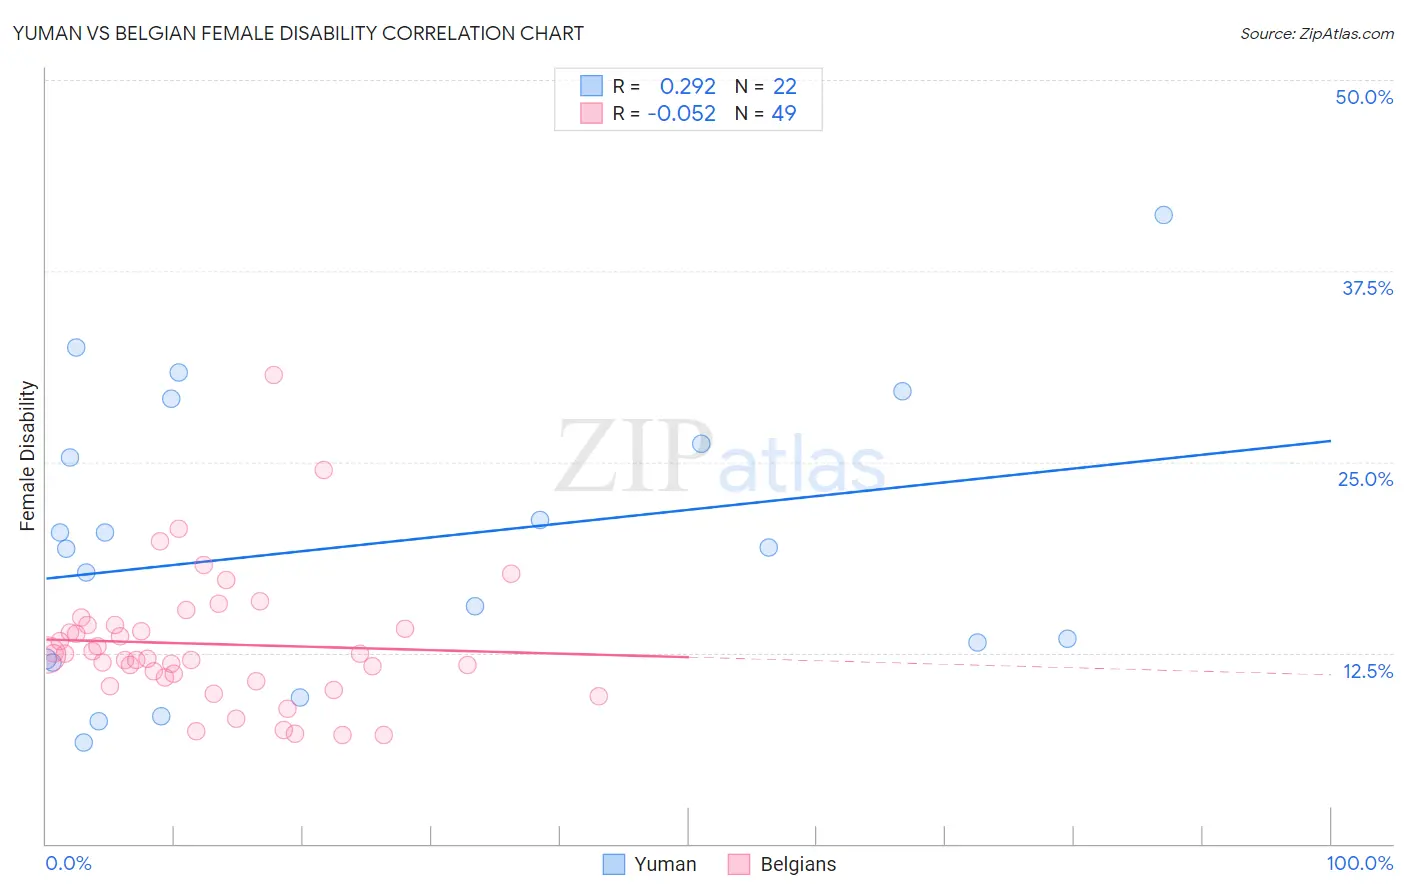
Yuman vs Belgian Female Disability Correlation Chart
The statistical analysis conducted on geographies consisting of 40,663,029 people shows a weak positive correlation between the proportion of Yuman and percentage of females with a disability in the United States with a correlation coefficient (R) of 0.292 and weighted average of 14.5%. Similarly, the statistical analysis conducted on geographies consisting of 355,987,027 people shows a slight negative correlation between the proportion of Belgians and percentage of females with a disability in the United States with a correlation coefficient (R) of -0.052 and weighted average of 12.5%, a difference of 16.0%.
Female Disability Correlation Summary
| Measurement | Yuman | Belgian |
| Minimum | 6.6% | 7.1% |
| Maximum | 41.2% | 30.7% |
| Range | 34.6% | 23.6% |
| Mean | 19.6% | 13.1% |
| Median | 19.4% | 12.3% |
| Interquartile 25% (IQ1) | 12.1% | 10.8% |
| Interquartile 75% (IQ3) | 26.2% | 14.3% |
| Interquartile Range (IQR) | 14.0% | 3.5% |
| Standard Deviation (Sample) | 9.2% | 4.4% |
| Standard Deviation (Population) | 9.0% | 4.3% |
Similar Demographics by Female Disability
Demographics Similar to Yuman by Female Disability
In terms of female disability, the demographic groups most similar to Yuman are Immigrants from Cabo Verde (14.6%, a difference of 0.42%), Osage (14.3%, a difference of 1.4%), Ottawa (14.2%, a difference of 1.8%), Cape Verdean (14.2%, a difference of 1.8%), and Pima (14.8%, a difference of 2.0%).
| Demographics | Rating | Rank | Female Disability |
| Blacks/African Americans | 0.0 /100 | #323 | Tragic 14.1% |
| Natives/Alaskans | 0.0 /100 | #324 | Tragic 14.1% |
| Navajo | 0.0 /100 | #325 | Tragic 14.2% |
| Comanche | 0.0 /100 | #326 | Tragic 14.2% |
| Ottawa | 0.0 /100 | #327 | Tragic 14.2% |
| Cape Verdeans | 0.0 /100 | #328 | Tragic 14.2% |
| Osage | 0.0 /100 | #329 | Tragic 14.3% |
| Yuman | 0.0 /100 | #330 | Tragic 14.5% |
| Immigrants | Cabo Verde | 0.0 /100 | #331 | Tragic 14.6% |
| Pima | 0.0 /100 | #332 | Tragic 14.8% |
| Immigrants | Azores | 0.0 /100 | #333 | Tragic 14.9% |
| Cherokee | 0.0 /100 | #334 | Tragic 14.9% |
| Cajuns | 0.0 /100 | #335 | Tragic 14.9% |
| Seminole | 0.0 /100 | #336 | Tragic 15.0% |
| Tohono O'odham | 0.0 /100 | #337 | Tragic 15.0% |
Demographics Similar to Belgians by Female Disability
In terms of female disability, the demographic groups most similar to Belgians are Immigrants from Belize (12.5%, a difference of 0.070%), Immigrants from Somalia (12.5%, a difference of 0.090%), Hungarian (12.5%, a difference of 0.11%), Immigrants from Cambodia (12.5%, a difference of 0.18%), and Immigrants from Iraq (12.5%, a difference of 0.19%).
| Demographics | Rating | Rank | Female Disability |
| Belizeans | 9.3 /100 | #224 | Tragic 12.5% |
| Poles | 8.4 /100 | #225 | Tragic 12.5% |
| Hispanics or Latinos | 8.0 /100 | #226 | Tragic 12.5% |
| Assyrians/Chaldeans/Syriacs | 8.0 /100 | #227 | Tragic 12.5% |
| Immigrants | Cambodia | 7.8 /100 | #228 | Tragic 12.5% |
| Hungarians | 7.2 /100 | #229 | Tragic 12.5% |
| Immigrants | Belize | 7.0 /100 | #230 | Tragic 12.5% |
| Belgians | 6.5 /100 | #231 | Tragic 12.5% |
| Immigrants | Somalia | 5.9 /100 | #232 | Tragic 12.5% |
| Immigrants | Iraq | 5.3 /100 | #233 | Tragic 12.5% |
| Scandinavians | 5.3 /100 | #234 | Tragic 12.5% |
| Malaysians | 5.0 /100 | #235 | Tragic 12.5% |
| Immigrants | West Indies | 4.4 /100 | #236 | Tragic 12.6% |
| Slavs | 3.8 /100 | #237 | Tragic 12.6% |
| Yugoslavians | 3.7 /100 | #238 | Tragic 12.6% |