U.S. Virgin Islander vs Immigrants from Argentina Female Disability

COMPARE

U.S. Virgin Islander
Race
Ancestry
AfghanAfricanAlaska NativeAlaskan AthabascanAlbanianAleutAlsatianAmericanApacheArabArapahoArgentineanArmenianAssyrian/Chaldean/SyriacAustralianAustrianBahamianBangladeshiBarbadianBasqueBelgianBelizeanBermudanBhutaneseBlackfeetBolivianBrazilianBritishBritish West IndianBulgarianBurmeseCajunCambodianCanadianCape VerdeanCarpatho RusynCelticCentral AmericanCentral American IndianCherokeeCheyenneChickasawChileanChineseChippewaChoctawColombianColvilleComancheCosta RicanCreeCreekCroatianCrowCubanCypriotCzechCzechoslovakianDanishDelawareDominicanDutchDutch West IndianEastern EuropeanEcuadorianEgyptianEnglishEstonianEthiopianEuropeanFijianFilipinoFinnishFrenchFrench American IndianFrench CanadianGermanGerman RussianGhanaianGreekGuamanian/ChamorroGuatemalanGuyaneseHaitianHmongHonduranHopiHoumaHungarianIcelanderIndian (Asian)IndonesianInupiatIranianIraqiIrishIroquoisIsraeliItalianJamaicanJapaneseJordanianKenyanKiowaKoreanLaotianLatvianLebaneseLiberianLithuanianLumbeeLuxembourgerMacedonianMalaysianMalteseMarshalleseMenomineeMexicanMexican American IndianMongolianMoroccanNative HawaiianNavajoNepaleseNew ZealanderNicaraguanNigerianNorthern EuropeanNorwegianOkinawanOsageOttawaPaiutePakistaniPalestinianPanamanianParaguayanPennsylvania GermanPeruvianPimaPolishPortuguesePotawatomiPuebloPuerto RicanPuget Sound SalishRomanianRussianSalvadoranSamoanScandinavianScotch-IrishScottishSeminoleSenegaleseSerbianShoshoneSierra LeoneanSiouxSlavicSlovakSloveneSomaliSouth AfricanSouth AmericanSouth American IndianSoviet UnionSpaniardSpanishSpanish AmericanSpanish American IndianSri LankanSubsaharan AfricanSudaneseSwedishSwissSyrianTaiwaneseThaiTlingit-HaidaTohono O'OdhamTonganTrinidadian and TobagonianTsimshianTurkishU.S. Virgin IslanderUgandanUkrainianUruguayanUteVenezuelanVietnameseWelshWest IndianYakamaYaquiYugoslavianYumanYup'ikZimbabwean
Immigration
NonimmigrantsImmigrantsAfghanistanAfricaAlbaniaArmeniaAsiaAustraliaAustriaBahamasBangladeshBarbadosBelarusBelgiumBelizeBoliviaBosnia and HerzegovinaBrazilBulgariaBurma/MyanmarCabo VerdeCambodiaCameroonCanadaCaribbeanCentral AmericaChileChinaColombiaCongoCosta RicaCroatiaCubaCzechoslovakiaDenmarkDominicaDominican RepublicEastern AfricaEastern AsiaEastern EuropeEcuadorEgyptEl SalvadorEnglandEritreaEthiopiaEuropeFijiFranceGermanyGhanaGreeceGrenadaGuatemalaGuyanaHaitiHondurasHong KongHungaryIndiaIndonesiaIranIraqIrelandIsraelItalyJamaicaJapanJordanKazakhstanKenyaKoreaKuwaitLaosLatin AmericaLatviaLebanonLiberiaLithuaniaMalaysiaMexicoMicronesiaMiddle AfricaMoldovaMoroccoNepalNetherlandsNicaraguaNigeriaNorth AmericaNorth MacedoniaNorthern AfricaNorthern EuropeNorwayOceaniaPakistanPanamaPeruPhilippinesPolandPortugalRomaniaRussiaSaudi ArabiaScotlandSenegalSerbiaSierra LeoneSingaporeSomaliaSouth AfricaSouth AmericaSouth Central AsiaSouth Eastern AsiaSouthern EuropeSpainSri LankaSt. Vincent and the GrenadinesSudanSwedenSwitzerlandSyriaTaiwanThailandTrinidad and TobagoTurkeyUgandaUkraineUruguayUzbekistanVenezuelaVietnamWest IndiesWestern AfricaWestern AsiaWestern EuropeYemenZaireZimbabweAzores
Immigrants from Argentina
Race
Ancestry
AfghanAfricanAlaska NativeAlaskan AthabascanAlbanianAleutAlsatianAmericanApacheArabArapahoArgentineanArmenianAssyrian/Chaldean/SyriacAustralianAustrianBahamianBangladeshiBarbadianBasqueBelgianBelizeanBermudanBhutaneseBlackfeetBolivianBrazilianBritishBritish West IndianBulgarianBurmeseCajunCambodianCanadianCape VerdeanCarpatho RusynCelticCentral AmericanCentral American IndianCherokeeCheyenneChickasawChileanChineseChippewaChoctawColombianColvilleComancheCosta RicanCreeCreekCroatianCrowCubanCypriotCzechCzechoslovakianDanishDelawareDominicanDutchDutch West IndianEastern EuropeanEcuadorianEgyptianEnglishEstonianEthiopianEuropeanFijianFilipinoFinnishFrenchFrench American IndianFrench CanadianGermanGerman RussianGhanaianGreekGuamanian/ChamorroGuatemalanGuyaneseHaitianHmongHonduranHopiHoumaHungarianIcelanderIndian (Asian)IndonesianInupiatIranianIraqiIrishIroquoisIsraeliItalianJamaicanJapaneseJordanianKenyanKiowaKoreanLaotianLatvianLebaneseLiberianLithuanianLumbeeLuxembourgerMacedonianMalaysianMalteseMarshalleseMenomineeMexicanMexican American IndianMongolianMoroccanNative HawaiianNavajoNepaleseNew ZealanderNicaraguanNigerianNorthern EuropeanNorwegianOkinawanOsageOttawaPaiutePakistaniPalestinianPanamanianParaguayanPennsylvania GermanPeruvianPimaPolishPortuguesePotawatomiPuebloPuerto RicanPuget Sound SalishRomanianRussianSalvadoranSamoanScandinavianScotch-IrishScottishSeminoleSenegaleseSerbianShoshoneSierra LeoneanSiouxSlavicSlovakSloveneSomaliSouth AfricanSouth AmericanSouth American IndianSoviet UnionSpaniardSpanishSpanish AmericanSpanish American IndianSri LankanSubsaharan AfricanSudaneseSwedishSwissSyrianTaiwaneseThaiTlingit-HaidaTohono O'OdhamTonganTrinidadian and TobagonianTsimshianTurkishUgandanUkrainianUruguayanUteVenezuelanVietnameseWelshWest IndianYakamaYaquiYugoslavianYumanYup'ikZimbabwean
Immigration
NonimmigrantsImmigrantsAfghanistanAfricaAlbaniaArgentinaArmeniaAsiaAustraliaAustriaBahamasBangladeshBarbadosBelarusBelgiumBelizeBoliviaBosnia and HerzegovinaBrazilBulgariaBurma/MyanmarCabo VerdeCambodiaCameroonCanadaCaribbeanCentral AmericaChileChinaColombiaCongoCosta RicaCroatiaCubaCzechoslovakiaDenmarkDominicaDominican RepublicEastern AfricaEastern AsiaEastern EuropeEcuadorEgyptEl SalvadorEnglandEritreaEthiopiaEuropeFijiFranceGermanyGhanaGreeceGrenadaGuatemalaGuyanaHaitiHondurasHong KongHungaryIndiaIndonesiaIranIraqIrelandIsraelItalyJamaicaJapanJordanKazakhstanKenyaKoreaKuwaitLaosLatin AmericaLatviaLebanonLiberiaLithuaniaMalaysiaMexicoMicronesiaMiddle AfricaMoldovaMoroccoNepalNetherlandsNicaraguaNigeriaNorth AmericaNorth MacedoniaNorthern AfricaNorthern EuropeNorwayOceaniaPakistanPanamaPeruPhilippinesPolandPortugalRomaniaRussiaSaudi ArabiaScotlandSenegalSerbiaSierra LeoneSingaporeSomaliaSouth AfricaSouth AmericaSouth Central AsiaSouth Eastern AsiaSouthern EuropeSpainSri LankaSt. Vincent and the GrenadinesSudanSwedenSwitzerlandSyriaTaiwanThailandTrinidad and TobagoTurkeyUgandaUkraineUruguayUzbekistanVenezuelaVietnamWest IndiesWestern AfricaWestern AsiaWestern EuropeYemenZaireZimbabweAzores
Female Disability
Income
Poverty
Unemployment
Labor Participation
Family Structure
Vehicle Availability
Education Level
Disability

Female Disability Comparison

U.S. Virgin Islanders

Immigrants from Argentina

Tragic
Exceptional
13.1%
FEMALE DISABILITY
0.1/ 100
METRIC RATING
281st/ 347
METRIC RANK
11.0%
FEMALE DISABILITY
100.0/ 100
METRIC RATING
24th/ 347
METRIC RANK

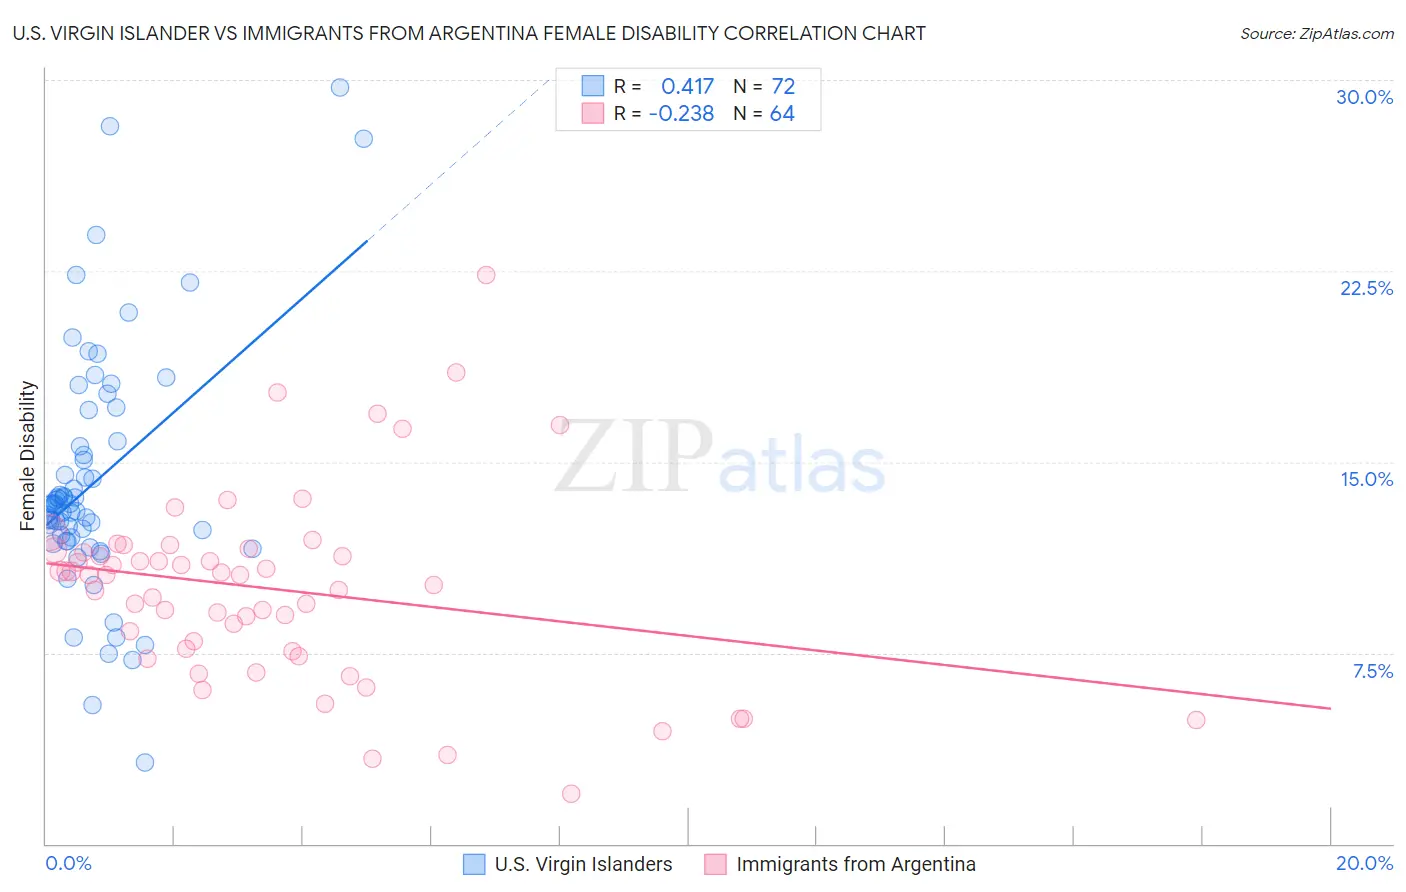
U.S. Virgin Islander vs Immigrants from Argentina Female Disability Correlation Chart

The statistical analysis conducted on geographies consisting of 87,518,599 people shows a moderate positive correlation between the proportion of U.S. Virgin Islanders and percentage of females with a disability in the United States with a correlation coefficient (R) of 0.417 and weighted average of 13.1%. Similarly, the statistical analysis conducted on geographies consisting of 264,430,891 people shows a weak negative correlation between the proportion of Immigrants from Argentina and percentage of females with a disability in the United States with a correlation coefficient (R) of -0.238 and weighted average of 11.0%, a difference of 18.6%.
U.S. Virgin Islander vs Immigrants from Argentina Female Disability

Female Disability Correlation Summary

MeasurementU.S. Virgin IslanderImmigrants from Argentina
Minimum3.2%1.9%
Maximum29.7%22.3%
Range26.5%20.4%
Mean14.2%10.0%
Median13.3%10.6%
Interquartile 25% (IQ1)12.0%7.6%
Interquartile 75% (IQ3)15.7%11.5%
Interquartile Range (IQR)3.8%3.8%
Standard Deviation (Sample)4.8%3.7%
Standard Deviation (Population)4.8%3.7%

Similar Demographics by Female Disability

Demographics Similar to U.S. Virgin Islanders by Female Disability

In terms of female disability, the demographic groups most similar to U.S. Virgin Islanders are Irish (13.1%, a difference of 0.030%), Welsh (13.1%, a difference of 0.080%), English (13.1%, a difference of 0.080%), Arapaho (13.0%, a difference of 0.12%), and Hmong (13.1%, a difference of 0.22%).
DemographicsRating | RankFemale Disability
Portuguese
0.1
/100
|
#274
Tragic
13.0%
Cheyenne
0.1
/100
|
#275
Tragic
13.0%
Immigrants | Dominica
0.1
/100
|
#276
Tragic
13.0%
Spanish
0.1
/100
|
#277
Tragic
13.0%
Scottish
0.1
/100
|
#278
Tragic
13.0%
Arapaho
0.1
/100
|
#279
Tragic
13.0%
Irish
0.1
/100
|
#280
Tragic
13.1%
U.S. Virgin Islanders
0.1
/100
|
#281
Tragic
13.1%
Welsh
0.0
/100
|
#282
Tragic
13.1%
English
0.0
/100
|
#283
Tragic
13.1%
Hmong
0.0
/100
|
#284
Tragic
13.1%
Bangladeshis
0.0
/100
|
#285
Tragic
13.1%
Fijians
0.0
/100
|
#286
Tragic
13.1%
Yaqui
0.0
/100
|
#287
Tragic
13.2%
Whites/Caucasians
0.0
/100
|
#288
Tragic
13.2%

Demographics Similar to Immigrants from Argentina by Female Disability

In terms of female disability, the demographic groups most similar to Immigrants from Argentina are Immigrants from Asia (11.0%, a difference of 0.030%), Argentinean (11.0%, a difference of 0.070%), Immigrants from Turkey (11.1%, a difference of 0.47%), Venezuelan (11.0%, a difference of 0.57%), and Egyptian (11.1%, a difference of 0.74%).
DemographicsRating | RankFemale Disability
Indians (Asian)
100.0
/100
|
#17
Exceptional
10.8%
Immigrants | Iran
100.0
/100
|
#18
Exceptional
10.8%
Immigrants | Venezuela
100.0
/100
|
#19
Exceptional
10.9%
Immigrants | Pakistan
100.0
/100
|
#20
Exceptional
10.9%
Asians
100.0
/100
|
#21
Exceptional
10.9%
Immigrants | Sri Lanka
100.0
/100
|
#22
Exceptional
10.9%
Venezuelans
100.0
/100
|
#23
Exceptional
11.0%
Immigrants | Argentina
100.0
/100
|
#24
Exceptional
11.0%
Immigrants | Asia
100.0
/100
|
#25
Exceptional
11.0%
Argentineans
100.0
/100
|
#26
Exceptional
11.0%
Immigrants | Turkey
100.0
/100
|
#27
Exceptional
11.1%
Egyptians
100.0
/100
|
#28
Exceptional
11.1%
Immigrants | Malaysia
100.0
/100
|
#29
Exceptional
11.1%
Turks
100.0
/100
|
#30
Exceptional
11.1%
Immigrants | Kuwait
100.0
/100
|
#31
Exceptional
11.1%