Uruguayan vs British West Indian Male Disability
COMPARE
Uruguayan
British West Indian
Male Disability
Male Disability Comparison
Uruguayans
British West Indians
10.7%
MALE DISABILITY
95.3/ 100
METRIC RATING
103rd/ 347
METRIC RANK
11.1%
MALE DISABILITY
62.8/ 100
METRIC RATING
164th/ 347
METRIC RANK
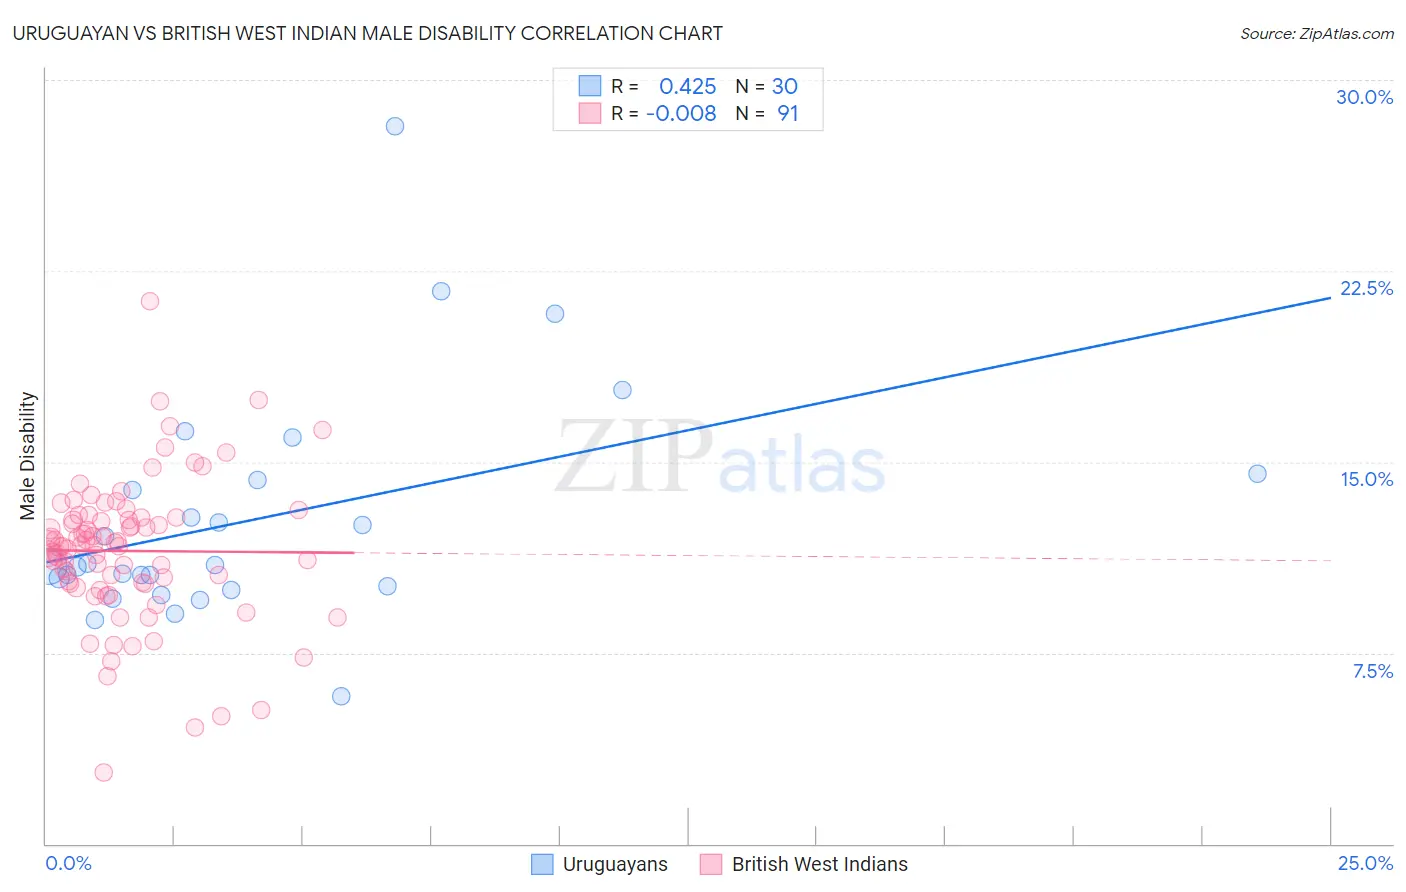
Uruguayan vs British West Indian Male Disability Correlation Chart
The statistical analysis conducted on geographies consisting of 144,784,300 people shows a moderate positive correlation between the proportion of Uruguayans and percentage of males with a disability in the United States with a correlation coefficient (R) of 0.425 and weighted average of 10.7%. Similarly, the statistical analysis conducted on geographies consisting of 152,682,334 people shows no correlation between the proportion of British West Indians and percentage of males with a disability in the United States with a correlation coefficient (R) of -0.008 and weighted average of 11.1%, a difference of 3.6%.
Male Disability Correlation Summary
| Measurement | Uruguayan | British West Indian |
| Minimum | 5.8% | 2.8% |
| Maximum | 28.2% | 21.3% |
| Range | 22.4% | 18.5% |
| Mean | 12.7% | 11.5% |
| Median | 10.9% | 11.7% |
| Interquartile 25% (IQ1) | 10.1% | 10.2% |
| Interquartile 75% (IQ3) | 14.3% | 12.8% |
| Interquartile Range (IQR) | 4.2% | 2.6% |
| Standard Deviation (Sample) | 4.5% | 2.8% |
| Standard Deviation (Population) | 4.5% | 2.8% |
Similar Demographics by Male Disability
Demographics Similar to Uruguayans by Male Disability
In terms of male disability, the demographic groups most similar to Uruguayans are Immigrants from Eastern Europe (10.7%, a difference of 0.010%), Immigrants from Nigeria (10.8%, a difference of 0.060%), Immigrants from Brazil (10.8%, a difference of 0.080%), Immigrants from Greece (10.7%, a difference of 0.11%), and Immigrants from Syria (10.8%, a difference of 0.12%).
| Demographics | Rating | Rank | Male Disability |
| Nicaraguans | 96.6 /100 | #96 | Exceptional 10.7% |
| Immigrants | Armenia | 96.6 /100 | #97 | Exceptional 10.7% |
| Immigrants | Romania | 96.5 /100 | #98 | Exceptional 10.7% |
| Immigrants | Switzerland | 96.1 /100 | #99 | Exceptional 10.7% |
| Immigrants | Kazakhstan | 95.9 /100 | #100 | Exceptional 10.7% |
| Immigrants | Greece | 95.6 /100 | #101 | Exceptional 10.7% |
| Immigrants | Eastern Europe | 95.3 /100 | #102 | Exceptional 10.7% |
| Uruguayans | 95.3 /100 | #103 | Exceptional 10.7% |
| Immigrants | Nigeria | 95.1 /100 | #104 | Exceptional 10.8% |
| Immigrants | Brazil | 95.0 /100 | #105 | Exceptional 10.8% |
| Immigrants | Syria | 94.9 /100 | #106 | Exceptional 10.8% |
| Immigrants | Eastern Africa | 94.3 /100 | #107 | Exceptional 10.8% |
| Immigrants | Belgium | 94.2 /100 | #108 | Exceptional 10.8% |
| Immigrants | Uganda | 94.0 /100 | #109 | Exceptional 10.8% |
| Immigrants | Immigrants | 93.9 /100 | #110 | Exceptional 10.8% |
Demographics Similar to British West Indians by Male Disability
In terms of male disability, the demographic groups most similar to British West Indians are Luxembourger (11.1%, a difference of 0.050%), Immigrants from Kenya (11.1%, a difference of 0.060%), Immigrants from Hungary (11.1%, a difference of 0.090%), Immigrants from Haiti (11.1%, a difference of 0.15%), and Immigrants from West Indies (11.1%, a difference of 0.18%).
| Demographics | Rating | Rank | Male Disability |
| Immigrants | Western Africa | 69.2 /100 | #157 | Good 11.1% |
| Latvians | 68.1 /100 | #158 | Good 11.1% |
| Guatemalans | 67.2 /100 | #159 | Good 11.1% |
| Albanians | 66.5 /100 | #160 | Good 11.1% |
| Immigrants | West Indies | 65.7 /100 | #161 | Good 11.1% |
| Immigrants | Haiti | 65.3 /100 | #162 | Good 11.1% |
| Immigrants | Kenya | 63.8 /100 | #163 | Good 11.1% |
| British West Indians | 62.8 /100 | #164 | Good 11.1% |
| Luxembourgers | 61.9 /100 | #165 | Good 11.1% |
| Immigrants | Hungary | 61.2 /100 | #166 | Good 11.1% |
| Immigrants | Southern Europe | 54.4 /100 | #167 | Average 11.2% |
| Immigrants | Latin America | 54.0 /100 | #168 | Average 11.2% |
| Barbadians | 53.4 /100 | #169 | Average 11.2% |
| New Zealanders | 52.9 /100 | #170 | Average 11.2% |
| Haitians | 52.5 /100 | #171 | Average 11.2% |