Uruguayan vs Immigrants from Fiji Male Disability
COMPARE
Uruguayan
Immigrants from Fiji
Male Disability
Male Disability Comparison
Uruguayans
Immigrants from Fiji
10.7%
MALE DISABILITY
95.3/ 100
METRIC RATING
103rd/ 347
METRIC RANK
11.0%
MALE DISABILITY
84.0/ 100
METRIC RATING
132nd/ 347
METRIC RANK
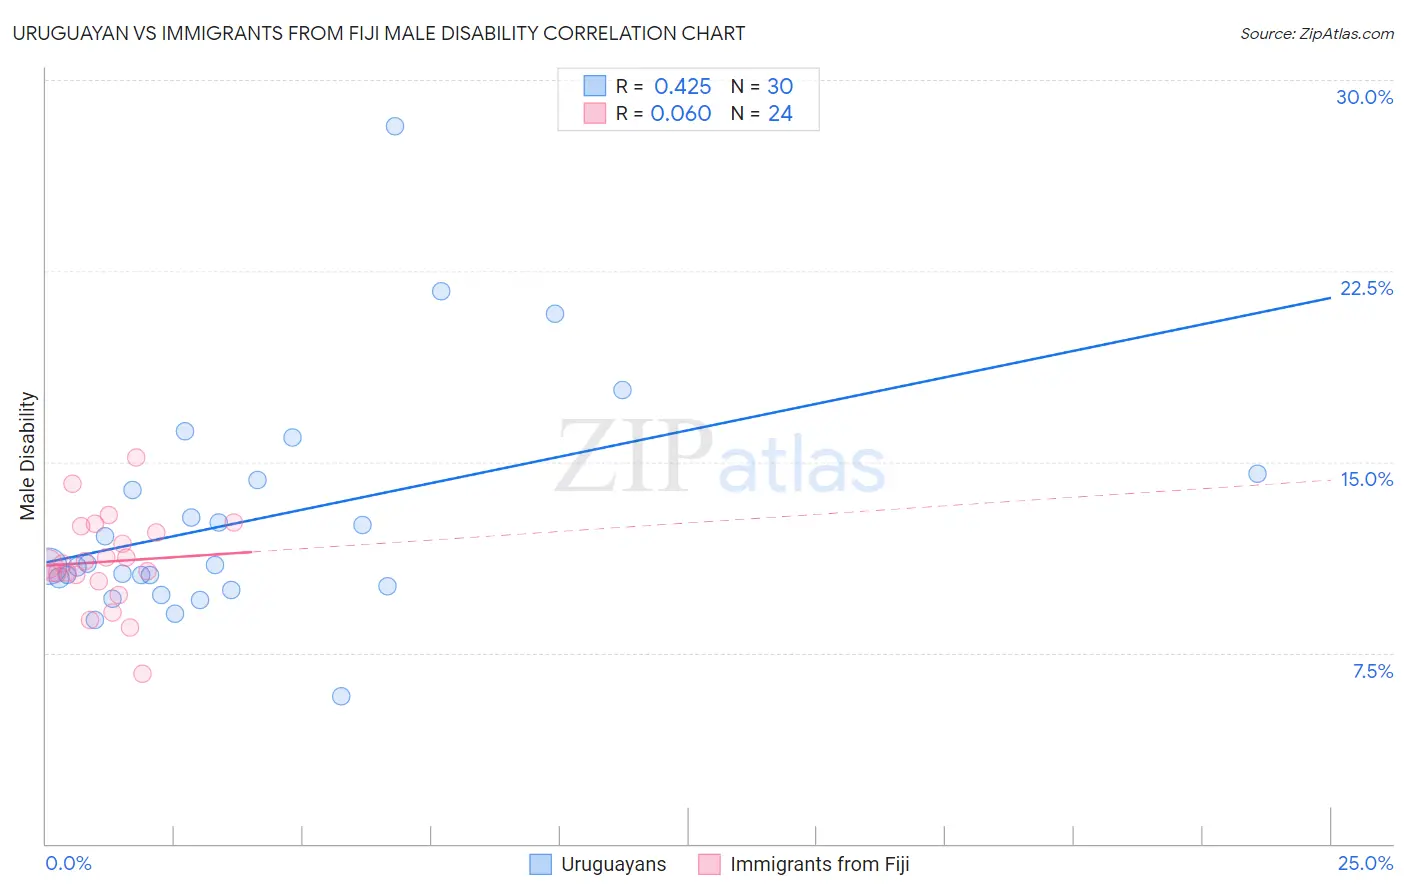
Uruguayan vs Immigrants from Fiji Male Disability Correlation Chart
The statistical analysis conducted on geographies consisting of 144,784,300 people shows a moderate positive correlation between the proportion of Uruguayans and percentage of males with a disability in the United States with a correlation coefficient (R) of 0.425 and weighted average of 10.7%. Similarly, the statistical analysis conducted on geographies consisting of 93,755,192 people shows a slight positive correlation between the proportion of Immigrants from Fiji and percentage of males with a disability in the United States with a correlation coefficient (R) of 0.060 and weighted average of 11.0%, a difference of 1.9%.
Male Disability Correlation Summary
| Measurement | Uruguayan | Immigrants from Fiji |
| Minimum | 5.8% | 6.7% |
| Maximum | 28.2% | 15.2% |
| Range | 22.4% | 8.5% |
| Mean | 12.7% | 11.1% |
| Median | 10.9% | 11.0% |
| Interquartile 25% (IQ1) | 10.1% | 10.4% |
| Interquartile 75% (IQ3) | 14.3% | 12.4% |
| Interquartile Range (IQR) | 4.2% | 1.9% |
| Standard Deviation (Sample) | 4.5% | 1.8% |
| Standard Deviation (Population) | 4.5% | 1.8% |
Similar Demographics by Male Disability
Demographics Similar to Uruguayans by Male Disability
In terms of male disability, the demographic groups most similar to Uruguayans are Immigrants from Eastern Europe (10.7%, a difference of 0.010%), Immigrants from Nigeria (10.8%, a difference of 0.060%), Immigrants from Brazil (10.8%, a difference of 0.080%), Immigrants from Greece (10.7%, a difference of 0.11%), and Immigrants from Syria (10.8%, a difference of 0.12%).
| Demographics | Rating | Rank | Male Disability |
| Nicaraguans | 96.6 /100 | #96 | Exceptional 10.7% |
| Immigrants | Armenia | 96.6 /100 | #97 | Exceptional 10.7% |
| Immigrants | Romania | 96.5 /100 | #98 | Exceptional 10.7% |
| Immigrants | Switzerland | 96.1 /100 | #99 | Exceptional 10.7% |
| Immigrants | Kazakhstan | 95.9 /100 | #100 | Exceptional 10.7% |
| Immigrants | Greece | 95.6 /100 | #101 | Exceptional 10.7% |
| Immigrants | Eastern Europe | 95.3 /100 | #102 | Exceptional 10.7% |
| Uruguayans | 95.3 /100 | #103 | Exceptional 10.7% |
| Immigrants | Nigeria | 95.1 /100 | #104 | Exceptional 10.8% |
| Immigrants | Brazil | 95.0 /100 | #105 | Exceptional 10.8% |
| Immigrants | Syria | 94.9 /100 | #106 | Exceptional 10.8% |
| Immigrants | Eastern Africa | 94.3 /100 | #107 | Exceptional 10.8% |
| Immigrants | Belgium | 94.2 /100 | #108 | Exceptional 10.8% |
| Immigrants | Uganda | 94.0 /100 | #109 | Exceptional 10.8% |
| Immigrants | Immigrants | 93.9 /100 | #110 | Exceptional 10.8% |
Demographics Similar to Immigrants from Fiji by Male Disability
In terms of male disability, the demographic groups most similar to Immigrants from Fiji are Ugandan (11.0%, a difference of 0.010%), Macedonian (11.0%, a difference of 0.020%), Bhutanese (11.0%, a difference of 0.070%), Trinidadian and Tobagonian (11.0%, a difference of 0.080%), and Immigrants from Costa Rica (11.0%, a difference of 0.13%).
| Demographics | Rating | Rank | Male Disability |
| Immigrants | North Macedonia | 88.1 /100 | #125 | Excellent 10.9% |
| Immigrants | Trinidad and Tobago | 86.9 /100 | #126 | Excellent 10.9% |
| Immigrants | Ukraine | 86.8 /100 | #127 | Excellent 10.9% |
| Immigrants | Latvia | 85.5 /100 | #128 | Excellent 10.9% |
| Immigrants | Philippines | 85.4 /100 | #129 | Excellent 10.9% |
| Brazilians | 85.4 /100 | #130 | Excellent 10.9% |
| Macedonians | 84.2 /100 | #131 | Excellent 11.0% |
| Immigrants | Fiji | 84.0 /100 | #132 | Excellent 11.0% |
| Ugandans | 83.9 /100 | #133 | Excellent 11.0% |
| Bhutanese | 83.4 /100 | #134 | Excellent 11.0% |
| Trinidadians and Tobagonians | 83.3 /100 | #135 | Excellent 11.0% |
| Immigrants | Costa Rica | 82.8 /100 | #136 | Excellent 11.0% |
| Immigrants | Europe | 82.0 /100 | #137 | Excellent 11.0% |
| Nigerians | 81.9 /100 | #138 | Excellent 11.0% |
| South Africans | 81.7 /100 | #139 | Excellent 11.0% |