Uruguayan vs Immigrants from Morocco Male Disability
COMPARE
Uruguayan
Immigrants from Morocco
Male Disability
Male Disability Comparison
Uruguayans
Immigrants from Morocco
10.7%
MALE DISABILITY
95.3/ 100
METRIC RATING
103rd/ 347
METRIC RANK
10.6%
MALE DISABILITY
97.7/ 100
METRIC RATING
90th/ 347
METRIC RANK
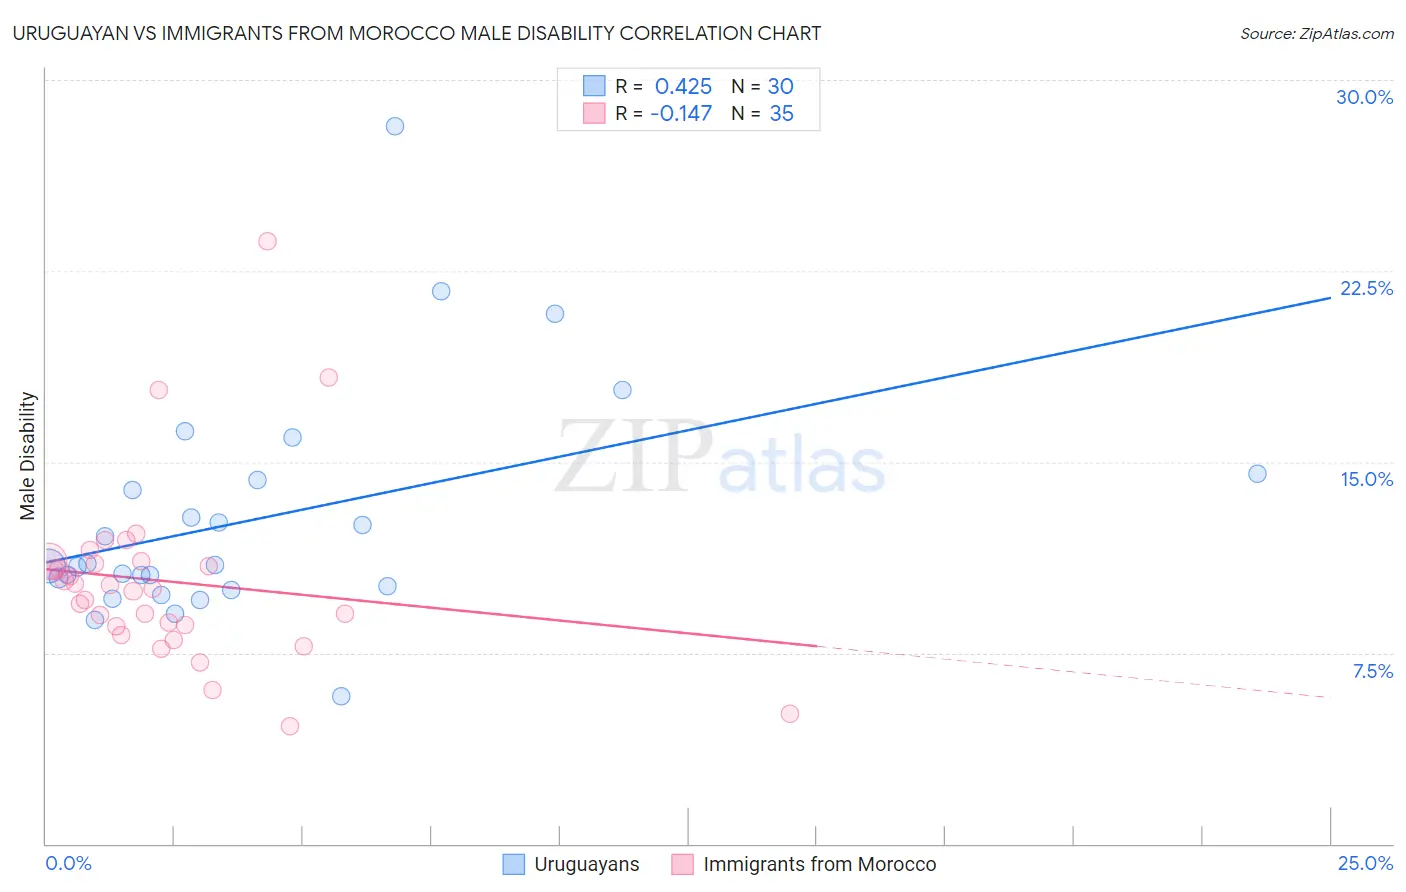
Uruguayan vs Immigrants from Morocco Male Disability Correlation Chart
The statistical analysis conducted on geographies consisting of 144,784,300 people shows a moderate positive correlation between the proportion of Uruguayans and percentage of males with a disability in the United States with a correlation coefficient (R) of 0.425 and weighted average of 10.7%. Similarly, the statistical analysis conducted on geographies consisting of 178,909,638 people shows a poor negative correlation between the proportion of Immigrants from Morocco and percentage of males with a disability in the United States with a correlation coefficient (R) of -0.147 and weighted average of 10.6%, a difference of 1.1%.
Male Disability Correlation Summary
| Measurement | Uruguayan | Immigrants from Morocco |
| Minimum | 5.8% | 4.6% |
| Maximum | 28.2% | 23.6% |
| Range | 22.4% | 19.0% |
| Mean | 12.7% | 10.3% |
| Median | 10.9% | 10.0% |
| Interquartile 25% (IQ1) | 10.1% | 8.5% |
| Interquartile 75% (IQ3) | 14.3% | 11.1% |
| Interquartile Range (IQR) | 4.2% | 2.5% |
| Standard Deviation (Sample) | 4.5% | 3.6% |
| Standard Deviation (Population) | 4.5% | 3.5% |
Demographics Similar to Uruguayans and Immigrants from Morocco by Male Disability
In terms of male disability, the demographic groups most similar to Uruguayans are Immigrants from Eastern Europe (10.7%, a difference of 0.010%), Immigrants from Nigeria (10.8%, a difference of 0.060%), Immigrants from Brazil (10.8%, a difference of 0.080%), Immigrants from Greece (10.7%, a difference of 0.11%), and Immigrants from Syria (10.8%, a difference of 0.12%). Similarly, the demographic groups most similar to Immigrants from Morocco are Immigrants from France (10.6%, a difference of 0.040%), Immigrants from Western Asia (10.6%, a difference of 0.050%), Immigrants from Nicaragua (10.6%, a difference of 0.050%), Immigrants from Vietnam (10.6%, a difference of 0.12%), and Immigrants from Ireland (10.6%, a difference of 0.14%).
| Demographics | Rating | Rank | Male Disability |
| Immigrants | Ireland | 97.9 /100 | #86 | Exceptional 10.6% |
| Immigrants | Vietnam | 97.9 /100 | #87 | Exceptional 10.6% |
| Immigrants | Western Asia | 97.8 /100 | #88 | Exceptional 10.6% |
| Immigrants | Nicaragua | 97.8 /100 | #89 | Exceptional 10.6% |
| Immigrants | Morocco | 97.7 /100 | #90 | Exceptional 10.6% |
| Immigrants | France | 97.6 /100 | #91 | Exceptional 10.6% |
| Palestinians | 97.4 /100 | #92 | Exceptional 10.7% |
| Immigrants | St. Vincent and the Grenadines | 97.1 /100 | #93 | Exceptional 10.7% |
| Immigrants | Sweden | 96.9 /100 | #94 | Exceptional 10.7% |
| Chileans | 96.9 /100 | #95 | Exceptional 10.7% |
| Nicaraguans | 96.6 /100 | #96 | Exceptional 10.7% |
| Immigrants | Armenia | 96.6 /100 | #97 | Exceptional 10.7% |
| Immigrants | Romania | 96.5 /100 | #98 | Exceptional 10.7% |
| Immigrants | Switzerland | 96.1 /100 | #99 | Exceptional 10.7% |
| Immigrants | Kazakhstan | 95.9 /100 | #100 | Exceptional 10.7% |
| Immigrants | Greece | 95.6 /100 | #101 | Exceptional 10.7% |
| Immigrants | Eastern Europe | 95.3 /100 | #102 | Exceptional 10.7% |
| Uruguayans | 95.3 /100 | #103 | Exceptional 10.7% |
| Immigrants | Nigeria | 95.1 /100 | #104 | Exceptional 10.8% |
| Immigrants | Brazil | 95.0 /100 | #105 | Exceptional 10.8% |
| Immigrants | Syria | 94.9 /100 | #106 | Exceptional 10.8% |