Immigrants from Eastern Europe vs Immigrants from Thailand Female Disability

COMPARE

Immigrants from Eastern Europe
Race
Ancestry
AfghanAfricanAlaska NativeAlaskan AthabascanAlbanianAleutAlsatianAmericanApacheArabArapahoArgentineanArmenianAssyrian/Chaldean/SyriacAustralianAustrianBahamianBangladeshiBarbadianBasqueBelgianBelizeanBermudanBhutaneseBlackfeetBolivianBrazilianBritishBritish West IndianBulgarianBurmeseCajunCambodianCanadianCape VerdeanCarpatho RusynCelticCentral AmericanCentral American IndianCherokeeCheyenneChickasawChileanChineseChippewaChoctawColombianColvilleComancheCosta RicanCreeCreekCroatianCrowCubanCypriotCzechCzechoslovakianDanishDelawareDominicanDutchDutch West IndianEastern EuropeanEcuadorianEgyptianEnglishEstonianEthiopianEuropeanFijianFilipinoFinnishFrenchFrench American IndianFrench CanadianGermanGerman RussianGhanaianGreekGuamanian/ChamorroGuatemalanGuyaneseHaitianHmongHonduranHopiHoumaHungarianIcelanderIndian (Asian)IndonesianInupiatIranianIraqiIrishIroquoisIsraeliItalianJamaicanJapaneseJordanianKenyanKiowaKoreanLaotianLatvianLebaneseLiberianLithuanianLumbeeLuxembourgerMacedonianMalaysianMalteseMarshalleseMenomineeMexicanMexican American IndianMongolianMoroccanNative HawaiianNavajoNepaleseNew ZealanderNicaraguanNigerianNorthern EuropeanNorwegianOkinawanOsageOttawaPaiutePakistaniPalestinianPanamanianParaguayanPennsylvania GermanPeruvianPimaPolishPortuguesePotawatomiPuebloPuerto RicanPuget Sound SalishRomanianRussianSalvadoranSamoanScandinavianScotch-IrishScottishSeminoleSenegaleseSerbianShoshoneSierra LeoneanSiouxSlavicSlovakSloveneSomaliSouth AfricanSouth AmericanSouth American IndianSoviet UnionSpaniardSpanishSpanish AmericanSpanish American IndianSri LankanSubsaharan AfricanSudaneseSwedishSwissSyrianTaiwaneseThaiTlingit-HaidaTohono O'OdhamTonganTrinidadian and TobagonianTsimshianTurkishU.S. Virgin IslanderUgandanUkrainianUruguayanUteVenezuelanVietnameseWelshWest IndianYakamaYaquiYugoslavianYumanYup'ikZimbabwean
Immigration
NonimmigrantsImmigrantsAfghanistanAfricaAlbaniaArgentinaArmeniaAsiaAustraliaAustriaBahamasBangladeshBarbadosBelarusBelgiumBelizeBoliviaBosnia and HerzegovinaBrazilBulgariaBurma/MyanmarCabo VerdeCambodiaCameroonCanadaCaribbeanCentral AmericaChileChinaColombiaCongoCosta RicaCroatiaCubaCzechoslovakiaDenmarkDominicaDominican RepublicEastern AfricaEastern AsiaEastern EuropeEcuadorEgyptEl SalvadorEnglandEritreaEthiopiaEuropeFijiFranceGermanyGhanaGreeceGrenadaGuatemalaGuyanaHaitiHondurasHong KongHungaryIndiaIndonesiaIranIraqIrelandIsraelItalyJamaicaJapanJordanKazakhstanKenyaKoreaKuwaitLaosLatin AmericaLatviaLebanonLiberiaLithuaniaMalaysiaMexicoMicronesiaMiddle AfricaMoldovaMoroccoNepalNetherlandsNicaraguaNigeriaNorth AmericaNorth MacedoniaNorthern AfricaNorthern EuropeNorwayOceaniaPakistanPanamaPeruPhilippinesPolandPortugalRomaniaRussiaSaudi ArabiaScotlandSenegalSerbiaSierra LeoneSingaporeSomaliaSouth AfricaSouth AmericaSouth Central AsiaSouth Eastern AsiaSouthern EuropeSpainSri LankaSt. Vincent and the GrenadinesSudanSwedenSwitzerlandSyriaTaiwanTrinidad and TobagoTurkeyUgandaUkraineUruguayUzbekistanVenezuelaVietnamWest IndiesWestern AfricaWestern AsiaWestern EuropeYemenZaireZimbabweAzores
Immigrants from Thailand
Race
Ancestry
AfghanAfricanAlaska NativeAlaskan AthabascanAlbanianAleutAlsatianAmericanApacheArabArapahoArgentineanArmenianAssyrian/Chaldean/SyriacAustralianAustrianBahamianBangladeshiBarbadianBasqueBelgianBelizeanBermudanBhutaneseBlackfeetBolivianBrazilianBritishBritish West IndianBulgarianBurmeseCajunCambodianCanadianCape VerdeanCarpatho RusynCelticCentral AmericanCentral American IndianCherokeeCheyenneChickasawChileanChineseChippewaChoctawColombianColvilleComancheCosta RicanCreeCreekCroatianCrowCubanCypriotCzechCzechoslovakianDanishDelawareDominicanDutchDutch West IndianEastern EuropeanEcuadorianEgyptianEnglishEstonianEthiopianEuropeanFijianFilipinoFinnishFrenchFrench American IndianFrench CanadianGermanGerman RussianGhanaianGreekGuamanian/ChamorroGuatemalanGuyaneseHaitianHmongHonduranHopiHoumaHungarianIcelanderIndian (Asian)IndonesianInupiatIranianIraqiIrishIroquoisIsraeliItalianJamaicanJapaneseJordanianKenyanKiowaKoreanLaotianLatvianLebaneseLiberianLithuanianLumbeeLuxembourgerMacedonianMalaysianMalteseMarshalleseMenomineeMexicanMexican American IndianMongolianMoroccanNative HawaiianNavajoNepaleseNew ZealanderNicaraguanNigerianNorthern EuropeanNorwegianOkinawanOsageOttawaPaiutePakistaniPalestinianPanamanianParaguayanPennsylvania GermanPeruvianPimaPolishPortuguesePotawatomiPuebloPuerto RicanPuget Sound SalishRomanianRussianSalvadoranSamoanScandinavianScotch-IrishScottishSeminoleSenegaleseSerbianShoshoneSierra LeoneanSiouxSlavicSlovakSloveneSomaliSouth AfricanSouth AmericanSouth American IndianSoviet UnionSpaniardSpanishSpanish AmericanSpanish American IndianSri LankanSubsaharan AfricanSudaneseSwedishSwissSyrianTaiwaneseThaiTlingit-HaidaTohono O'OdhamTonganTrinidadian and TobagonianTsimshianTurkishU.S. Virgin IslanderUgandanUkrainianUruguayanUteVenezuelanVietnameseWelshWest IndianYakamaYaquiYugoslavianYumanYup'ikZimbabwean
Immigration
NonimmigrantsImmigrantsAfghanistanAfricaAlbaniaArgentinaArmeniaAsiaAustraliaAustriaBahamasBangladeshBarbadosBelarusBelgiumBelizeBoliviaBosnia and HerzegovinaBrazilBulgariaBurma/MyanmarCabo VerdeCambodiaCameroonCanadaCaribbeanCentral AmericaChileChinaColombiaCongoCosta RicaCroatiaCubaCzechoslovakiaDenmarkDominicaDominican RepublicEastern AfricaEastern AsiaEcuadorEgyptEl SalvadorEnglandEritreaEthiopiaEuropeFijiFranceGermanyGhanaGreeceGrenadaGuatemalaGuyanaHaitiHondurasHong KongHungaryIndiaIndonesiaIranIraqIrelandIsraelItalyJamaicaJapanJordanKazakhstanKenyaKoreaKuwaitLaosLatin AmericaLatviaLebanonLiberiaLithuaniaMalaysiaMexicoMicronesiaMiddle AfricaMoldovaMoroccoNepalNetherlandsNicaraguaNigeriaNorth AmericaNorth MacedoniaNorthern AfricaNorthern EuropeNorwayOceaniaPakistanPanamaPeruPhilippinesPolandPortugalRomaniaRussiaSaudi ArabiaScotlandSenegalSerbiaSierra LeoneSingaporeSomaliaSouth AfricaSouth AmericaSouth Central AsiaSouth Eastern AsiaSouthern EuropeSpainSri LankaSt. Vincent and the GrenadinesSudanSwedenSwitzerlandSyriaTaiwanThailandTrinidad and TobagoTurkeyUgandaUkraineUruguayUzbekistanVenezuelaVietnamWest IndiesWestern AfricaWestern AsiaWestern EuropeYemenZaireZimbabweAzores
Female Disability
Income
Poverty
Unemployment
Labor Participation
Family Structure
Vehicle Availability
Education Level
Disability

Female Disability Comparison

Immigrants from Eastern Europe

Immigrants from Thailand

Exceptional
Poor
11.8%
FEMALE DISABILITY
97.2/ 100
METRIC RATING
117th/ 347
METRIC RANK
12.4%
FEMALE DISABILITY
14.5/ 100
METRIC RATING
213th/ 347
METRIC RANK

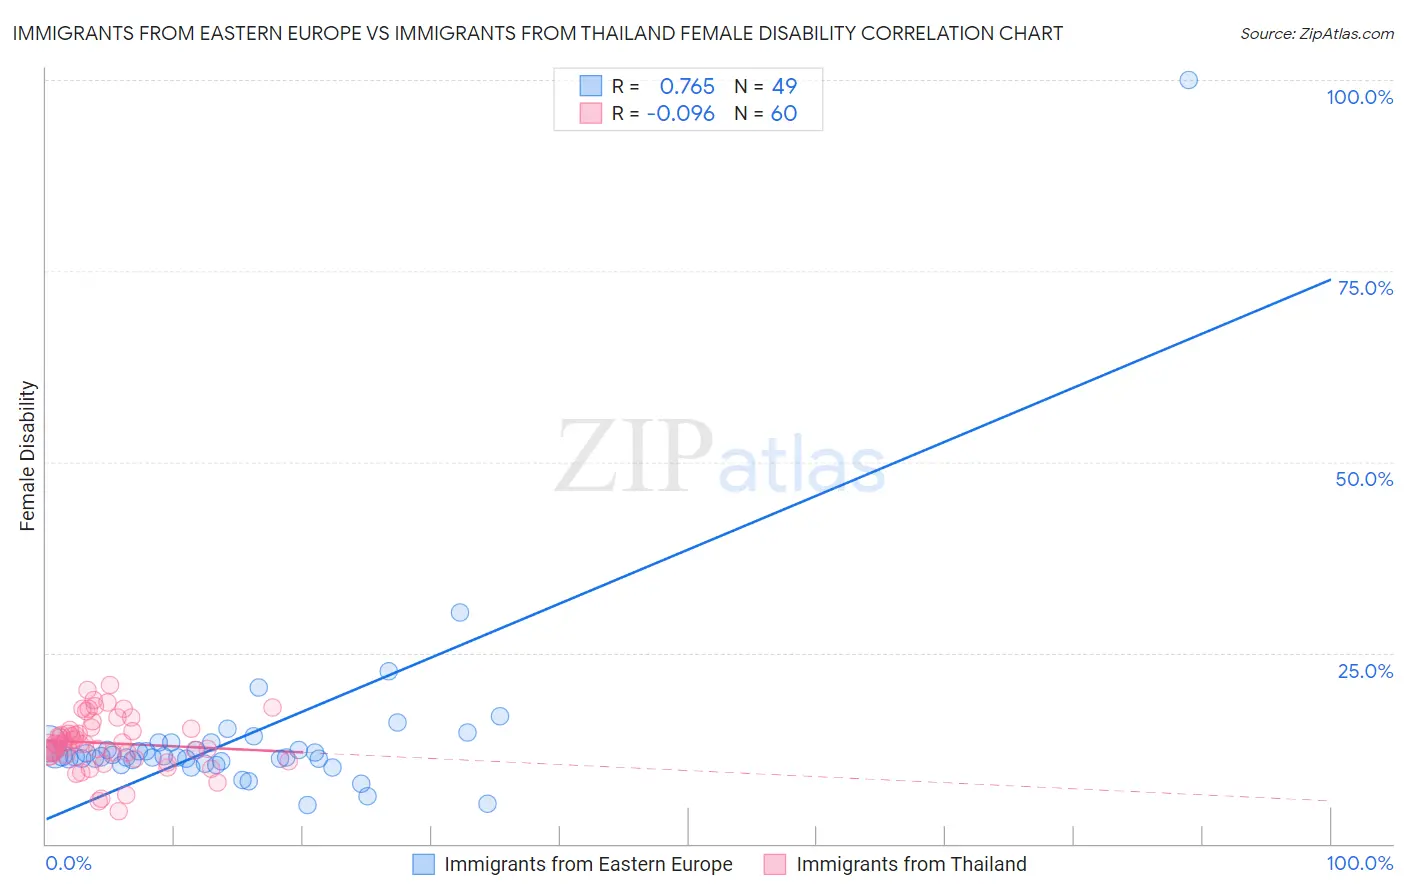
Immigrants from Eastern Europe vs Immigrants from Thailand Female Disability Correlation Chart

The statistical analysis conducted on geographies consisting of 475,778,439 people shows a strong positive correlation between the proportion of Immigrants from Eastern Europe and percentage of females with a disability in the United States with a correlation coefficient (R) of 0.765 and weighted average of 11.8%. Similarly, the statistical analysis conducted on geographies consisting of 316,982,742 people shows a slight negative correlation between the proportion of Immigrants from Thailand and percentage of females with a disability in the United States with a correlation coefficient (R) of -0.096 and weighted average of 12.4%, a difference of 5.2%.
Immigrants from Eastern Europe vs Immigrants from Thailand Female Disability

Female Disability Correlation Summary

MeasurementImmigrants from Eastern EuropeImmigrants from Thailand
Minimum5.1%4.3%
Maximum100.0%20.8%
Range94.9%16.5%
Mean13.9%13.2%
Median11.4%13.1%
Interquartile 25% (IQ1)10.9%11.7%
Interquartile 75% (IQ3)13.2%15.0%
Interquartile Range (IQR)2.3%3.3%
Standard Deviation (Sample)13.2%3.5%
Standard Deviation (Population)13.1%3.4%

Similar Demographics by Female Disability

Demographics Similar to Immigrants from Eastern Europe by Female Disability

In terms of female disability, the demographic groups most similar to Immigrants from Eastern Europe are Immigrants from Nigeria (11.8%, a difference of 0.0%), Immigrants from Uganda (11.8%, a difference of 0.010%), Immigrants from Kazakhstan (11.8%, a difference of 0.090%), Immigrants from Netherlands (11.8%, a difference of 0.11%), and Immigrants from North Macedonia (11.8%, a difference of 0.12%).
DemographicsRating | RankFemale Disability
Soviet Union
98.1
/100
|
#110
Exceptional
11.7%
Costa Ricans
98.1
/100
|
#111
Exceptional
11.7%
Immigrants | Bangladesh
97.8
/100
|
#112
Exceptional
11.8%
Immigrants | Belarus
97.8
/100
|
#113
Exceptional
11.8%
South Africans
97.7
/100
|
#114
Exceptional
11.8%
Brazilians
97.7
/100
|
#115
Exceptional
11.8%
Immigrants | Morocco
97.6
/100
|
#116
Exceptional
11.8%
Immigrants | Eastern Europe
97.2
/100
|
#117
Exceptional
11.8%
Immigrants | Nigeria
97.2
/100
|
#118
Exceptional
11.8%
Immigrants | Uganda
97.2
/100
|
#119
Exceptional
11.8%
Immigrants | Kazakhstan
97.0
/100
|
#120
Exceptional
11.8%
Immigrants | Netherlands
96.9
/100
|
#121
Exceptional
11.8%
Immigrants | North Macedonia
96.8
/100
|
#122
Exceptional
11.8%
Immigrants | Croatia
96.7
/100
|
#123
Exceptional
11.8%
Russians
96.5
/100
|
#124
Exceptional
11.8%

Demographics Similar to Immigrants from Thailand by Female Disability

In terms of female disability, the demographic groups most similar to Immigrants from Thailand are Ute (12.4%, a difference of 0.020%), Swiss (12.4%, a difference of 0.030%), Immigrants from Bosnia and Herzegovina (12.4%, a difference of 0.030%), Panamanian (12.4%, a difference of 0.080%), and Samoan (12.4%, a difference of 0.080%).
DemographicsRating | RankFemale Disability
Immigrants | Cuba
20.2
/100
|
#206
Fair
12.4%
Croatians
20.2
/100
|
#207
Fair
12.4%
Basques
17.5
/100
|
#208
Poor
12.4%
Mexicans
15.7
/100
|
#209
Poor
12.4%
Swiss
14.9
/100
|
#210
Poor
12.4%
Immigrants | Bosnia and Herzegovina
14.8
/100
|
#211
Poor
12.4%
Ute
14.7
/100
|
#212
Poor
12.4%
Immigrants | Thailand
14.5
/100
|
#213
Poor
12.4%
Panamanians
13.5
/100
|
#214
Poor
12.4%
Samoans
13.4
/100
|
#215
Poor
12.4%
Immigrants | Burma/Myanmar
13.3
/100
|
#216
Poor
12.4%
British
12.7
/100
|
#217
Poor
12.4%
Immigrants | Bahamas
12.5
/100
|
#218
Poor
12.4%
Europeans
12.1
/100
|
#219
Poor
12.4%
Bahamians
11.1
/100
|
#220
Poor
12.4%