Trinidadian and Tobagonian vs Kiowa Female Disability
COMPARE
Trinidadian and Tobagonian
Kiowa
Female Disability
Female Disability Comparison
Trinidadians and Tobagonians
Kiowa
12.3%
FEMALE DISABILITY
22.4/ 100
METRIC RATING
200th/ 347
METRIC RANK
15.8%
FEMALE DISABILITY
0.0/ 100
METRIC RATING
344th/ 347
METRIC RANK
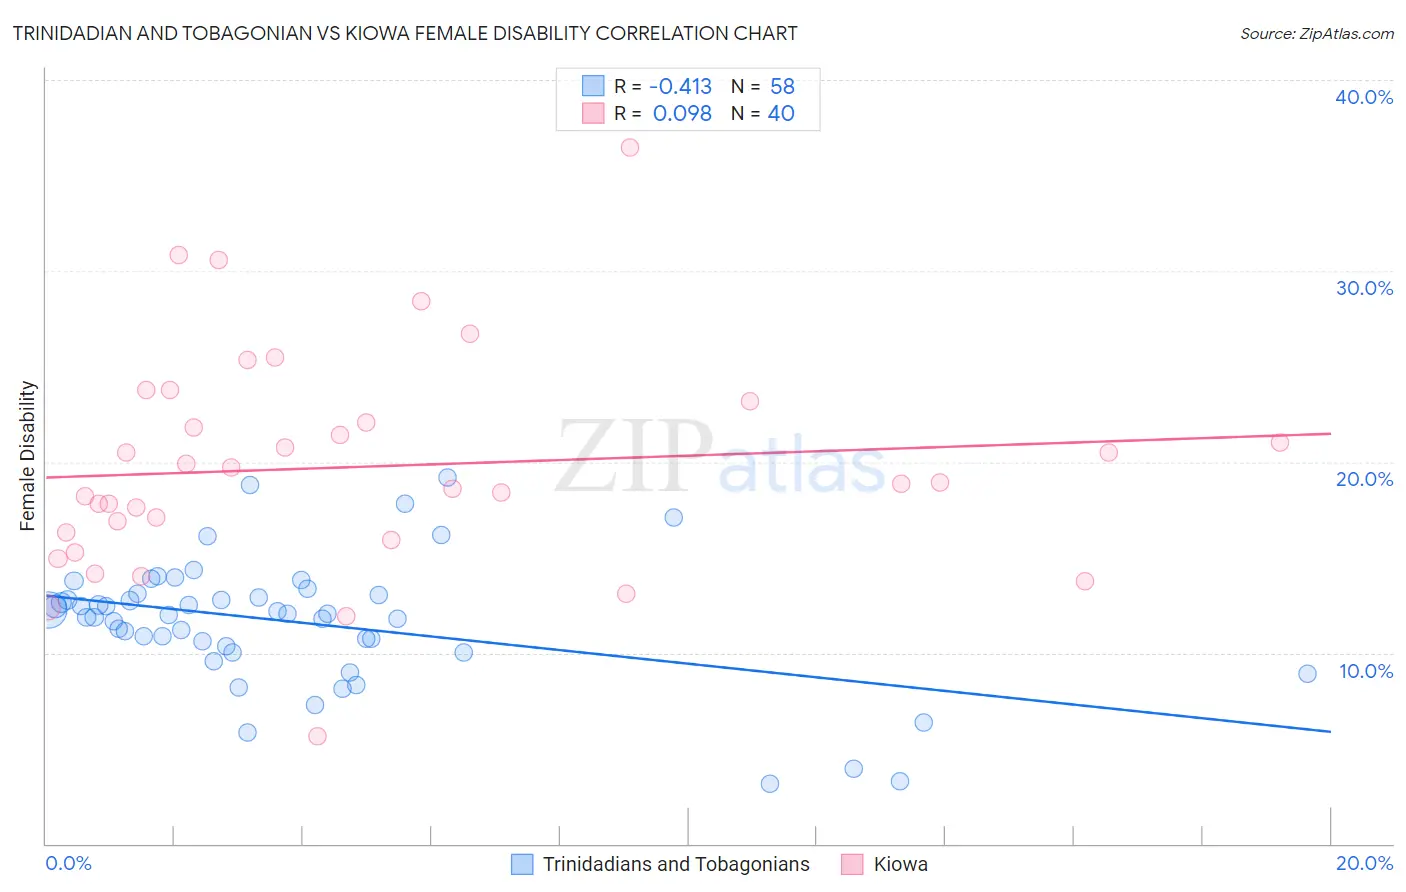
Trinidadian and Tobagonian vs Kiowa Female Disability Correlation Chart
The statistical analysis conducted on geographies consisting of 219,838,071 people shows a moderate negative correlation between the proportion of Trinidadians and Tobagonians and percentage of females with a disability in the United States with a correlation coefficient (R) of -0.413 and weighted average of 12.3%. Similarly, the statistical analysis conducted on geographies consisting of 56,098,208 people shows a slight positive correlation between the proportion of Kiowa and percentage of females with a disability in the United States with a correlation coefficient (R) of 0.098 and weighted average of 15.8%, a difference of 28.0%.
Female Disability Correlation Summary
| Measurement | Trinidadian and Tobagonian | Kiowa |
| Minimum | 3.2% | 5.6% |
| Maximum | 19.2% | 36.4% |
| Range | 16.0% | 30.8% |
| Mean | 11.6% | 19.7% |
| Median | 12.0% | 18.9% |
| Interquartile 25% (IQ1) | 10.3% | 16.1% |
| Interquartile 75% (IQ3) | 13.0% | 22.6% |
| Interquartile Range (IQR) | 2.7% | 6.5% |
| Standard Deviation (Sample) | 3.3% | 5.8% |
| Standard Deviation (Population) | 3.3% | 5.8% |
Similar Demographics by Female Disability
Demographics Similar to Trinidadians and Tobagonians by Female Disability
In terms of female disability, the demographic groups most similar to Trinidadians and Tobagonians are Chinese (12.3%, a difference of 0.010%), Somali (12.3%, a difference of 0.040%), Immigrants from Barbados (12.3%, a difference of 0.070%), Immigrants from Zaire (12.3%, a difference of 0.080%), and Immigrants from Grenada (12.4%, a difference of 0.10%).
| Demographics | Rating | Rank | Female Disability |
| Northern Europeans | 27.5 /100 | #193 | Fair 12.3% |
| Ukrainians | 27.2 /100 | #194 | Fair 12.3% |
| Swedes | 26.6 /100 | #195 | Fair 12.3% |
| Immigrants | Panama | 25.5 /100 | #196 | Fair 12.3% |
| Hondurans | 25.4 /100 | #197 | Fair 12.3% |
| Mexican American Indians | 24.9 /100 | #198 | Fair 12.3% |
| Immigrants | Trinidad and Tobago | 24.7 /100 | #199 | Fair 12.3% |
| Trinidadians and Tobagonians | 22.4 /100 | #200 | Fair 12.3% |
| Chinese | 22.1 /100 | #201 | Fair 12.3% |
| Somalis | 21.5 /100 | #202 | Fair 12.3% |
| Immigrants | Barbados | 21.1 /100 | #203 | Fair 12.3% |
| Immigrants | Zaire | 20.9 /100 | #204 | Fair 12.3% |
| Immigrants | Grenada | 20.5 /100 | #205 | Fair 12.4% |
| Immigrants | Cuba | 20.2 /100 | #206 | Fair 12.4% |
| Croatians | 20.2 /100 | #207 | Fair 12.4% |
Demographics Similar to Kiowa by Female Disability
In terms of female disability, the demographic groups most similar to Kiowa are Lumbee (15.8%, a difference of 0.16%), Creek (15.7%, a difference of 0.84%), Choctaw (15.4%, a difference of 2.5%), Chickasaw (15.2%, a difference of 3.9%), and Colville (15.1%, a difference of 4.8%).
| Demographics | Rating | Rank | Female Disability |
| Immigrants | Azores | 0.0 /100 | #333 | Tragic 14.9% |
| Cherokee | 0.0 /100 | #334 | Tragic 14.9% |
| Cajuns | 0.0 /100 | #335 | Tragic 14.9% |
| Seminole | 0.0 /100 | #336 | Tragic 15.0% |
| Tohono O'odham | 0.0 /100 | #337 | Tragic 15.0% |
| Dutch West Indians | 0.0 /100 | #338 | Tragic 15.0% |
| Colville | 0.0 /100 | #339 | Tragic 15.1% |
| Chickasaw | 0.0 /100 | #340 | Tragic 15.2% |
| Choctaw | 0.0 /100 | #341 | Tragic 15.4% |
| Creek | 0.0 /100 | #342 | Tragic 15.7% |
| Lumbee | 0.0 /100 | #343 | Tragic 15.8% |
| Kiowa | 0.0 /100 | #344 | Tragic 15.8% |
| Puerto Ricans | 0.0 /100 | #345 | Tragic 16.6% |
| Tsimshian | 0.0 /100 | #346 | Tragic 16.8% |
| Houma | 0.0 /100 | #347 | Tragic 16.9% |