Immigrants from Switzerland vs Brazilian Disability Age Under 5

COMPARE

Immigrants from Switzerland
Race
Ancestry
AfghanAfricanAlaska NativeAlaskan AthabascanAlbanianAleutAlsatianAmericanApacheArabArapahoArgentineanArmenianAssyrian/Chaldean/SyriacAustralianAustrianBahamianBangladeshiBarbadianBasqueBelgianBelizeanBermudanBhutaneseBlackfeetBolivianBritishBritish West IndianBulgarianBurmeseCajunCambodianCanadianCape VerdeanCarpatho RusynCelticCentral AmericanCentral American IndianCherokeeCheyenneChickasawChileanChineseChippewaChoctawColombianColvilleComancheCosta RicanCreeCreekCroatianCrowCubanCypriotCzechCzechoslovakianDanishDelawareDominicanDutchDutch West IndianEastern EuropeanEcuadorianEgyptianEnglishEstonianEthiopianEuropeanFijianFilipinoFinnishFrenchFrench American IndianFrench CanadianGermanGerman RussianGhanaianGreekGuamanian/ChamorroGuatemalanGuyaneseHaitianHmongHonduranHopiHoumaHungarianIcelanderIndian (Asian)IndonesianInupiatIranianIraqiIrishIroquoisIsraeliItalianJamaicanJapaneseJordanianKenyanKiowaKoreanLaotianLatvianLebaneseLiberianLithuanianLumbeeLuxembourgerMacedonianMalaysianMalteseMarshalleseMenomineeMexicanMexican American IndianMongolianMoroccanNative HawaiianNavajoNepaleseNew ZealanderNicaraguanNigerianNorthern EuropeanNorwegianOkinawanOsageOttawaPaiutePakistaniPalestinianPanamanianParaguayanPennsylvania GermanPeruvianPimaPolishPortuguesePotawatomiPuebloPuerto RicanPuget Sound SalishRomanianRussianSalvadoranSamoanScandinavianScotch-IrishScottishSeminoleSenegaleseSerbianShoshoneSierra LeoneanSiouxSlavicSlovakSloveneSomaliSouth AfricanSouth AmericanSouth American IndianSoviet UnionSpaniardSpanishSpanish AmericanSpanish American IndianSri LankanSubsaharan AfricanSudaneseSwedishSwissSyrianTaiwaneseThaiTlingit-HaidaTohono O'OdhamTonganTrinidadian and TobagonianTsimshianTurkishU.S. Virgin IslanderUgandanUkrainianUruguayanUteVenezuelanVietnameseWelshWest IndianYakamaYaquiYugoslavianYumanYup'ikZimbabwean
Immigration
NonimmigrantsImmigrantsAfghanistanAfricaAlbaniaArgentinaArmeniaAsiaAustraliaAustriaBahamasBangladeshBarbadosBelarusBelgiumBelizeBoliviaBosnia and HerzegovinaBrazilBulgariaBurma/MyanmarCabo VerdeCambodiaCameroonCanadaCaribbeanCentral AmericaChileChinaColombiaCongoCosta RicaCroatiaCubaCzechoslovakiaDenmarkDominicaDominican RepublicEastern AfricaEastern AsiaEastern EuropeEcuadorEgyptEl SalvadorEnglandEritreaEthiopiaEuropeFijiFranceGermanyGhanaGreeceGrenadaGuatemalaGuyanaHaitiHondurasHong KongHungaryIndiaIndonesiaIranIraqIrelandIsraelItalyJamaicaJapanJordanKazakhstanKenyaKoreaKuwaitLaosLatin AmericaLatviaLebanonLiberiaLithuaniaMalaysiaMexicoMicronesiaMiddle AfricaMoldovaMoroccoNepalNetherlandsNicaraguaNigeriaNorth AmericaNorth MacedoniaNorthern AfricaNorthern EuropeNorwayOceaniaPakistanPanamaPeruPhilippinesPolandPortugalRomaniaRussiaSaudi ArabiaScotlandSenegalSerbiaSierra LeoneSingaporeSomaliaSouth AfricaSouth AmericaSouth Central AsiaSouth Eastern AsiaSouthern EuropeSpainSri LankaSt. Vincent and the GrenadinesSudanSwedenSwitzerlandSyriaTaiwanThailandTrinidad and TobagoTurkeyUgandaUkraineUruguayUzbekistanVenezuelaVietnamWest IndiesWestern AfricaWestern AsiaWestern EuropeYemenZaireZimbabweAzores
Brazilian
Race
Ancestry
AfghanAfricanAlaska NativeAlaskan AthabascanAlbanianAleutAlsatianAmericanApacheArabArapahoArgentineanArmenianAssyrian/Chaldean/SyriacAustralianAustrianBahamianBangladeshiBarbadianBasqueBelgianBelizeanBermudanBhutaneseBlackfeetBolivianBrazilianBritishBritish West IndianBulgarianBurmeseCajunCambodianCanadianCape VerdeanCarpatho RusynCelticCentral AmericanCentral American IndianCherokeeCheyenneChickasawChileanChineseChippewaChoctawColombianColvilleComancheCosta RicanCreeCreekCroatianCrowCubanCypriotCzechCzechoslovakianDanishDelawareDominicanDutchDutch West IndianEastern EuropeanEcuadorianEgyptianEnglishEstonianEthiopianEuropeanFijianFilipinoFinnishFrenchFrench American IndianFrench CanadianGermanGerman RussianGhanaianGreekGuamanian/ChamorroGuatemalanGuyaneseHaitianHmongHonduranHopiHoumaHungarianIcelanderIndian (Asian)IndonesianInupiatIranianIraqiIrishIroquoisIsraeliItalianJamaicanJapaneseJordanianKenyanKiowaKoreanLaotianLatvianLebaneseLiberianLithuanianLumbeeLuxembourgerMacedonianMalaysianMalteseMarshalleseMenomineeMexicanMexican American IndianMongolianMoroccanNative HawaiianNavajoNepaleseNew ZealanderNicaraguanNigerianNorthern EuropeanNorwegianOkinawanOsageOttawaPaiutePakistaniPalestinianPanamanianParaguayanPennsylvania GermanPeruvianPimaPolishPortuguesePotawatomiPuebloPuerto RicanPuget Sound SalishRomanianRussianSalvadoranSamoanScandinavianScotch-IrishScottishSeminoleSenegaleseSerbianShoshoneSierra LeoneanSiouxSlavicSlovakSloveneSomaliSouth AfricanSouth AmericanSouth American IndianSoviet UnionSpaniardSpanishSpanish AmericanSpanish American IndianSri LankanSubsaharan AfricanSudaneseSwedishSwissSyrianTaiwaneseThaiTlingit-HaidaTohono O'OdhamTonganTrinidadian and TobagonianTsimshianTurkishU.S. Virgin IslanderUgandanUkrainianUruguayanUteVenezuelanVietnameseWelshWest IndianYakamaYaquiYugoslavianYumanYup'ikZimbabwean
Immigration
NonimmigrantsImmigrantsAfghanistanAfricaAlbaniaArgentinaArmeniaAsiaAustraliaAustriaBahamasBangladeshBarbadosBelarusBelgiumBelizeBoliviaBosnia and HerzegovinaBrazilBulgariaBurma/MyanmarCabo VerdeCambodiaCameroonCanadaCaribbeanCentral AmericaChileChinaColombiaCongoCosta RicaCroatiaCubaCzechoslovakiaDenmarkDominicaDominican RepublicEastern AfricaEastern AsiaEastern EuropeEcuadorEgyptEl SalvadorEnglandEritreaEthiopiaEuropeFijiFranceGermanyGhanaGreeceGrenadaGuatemalaGuyanaHaitiHondurasHong KongHungaryIndiaIndonesiaIranIraqIrelandIsraelItalyJamaicaJapanJordanKazakhstanKenyaKoreaKuwaitLaosLatin AmericaLatviaLebanonLiberiaLithuaniaMalaysiaMexicoMicronesiaMiddle AfricaMoldovaMoroccoNepalNetherlandsNicaraguaNigeriaNorth AmericaNorth MacedoniaNorthern AfricaNorthern EuropeNorwayOceaniaPakistanPanamaPeruPhilippinesPolandPortugalRomaniaRussiaSaudi ArabiaScotlandSenegalSerbiaSierra LeoneSingaporeSomaliaSouth AfricaSouth AmericaSouth Central AsiaSouth Eastern AsiaSouthern EuropeSpainSri LankaSt. Vincent and the GrenadinesSudanSwedenSyriaTaiwanThailandTrinidad and TobagoTurkeyUgandaUkraineUruguayUzbekistanVenezuelaVietnamWest IndiesWestern AfricaWestern AsiaWestern EuropeYemenZaireZimbabweAzores
Disability Age Under 5
Income
Poverty
Unemployment
Labor Participation
Family Structure
Vehicle Availability
Education Level
Disability

Disability Age Under 5 Comparison

Immigrants from Switzerland

Brazilians

Exceptional
Tragic
1.1%
DISABILITY AGE UNDER 5
99.2/ 100
METRIC RATING
62nd/ 347
METRIC RANK
1.5%
DISABILITY AGE UNDER 5
0.0/ 100
METRIC RATING
275th/ 347
METRIC RANK

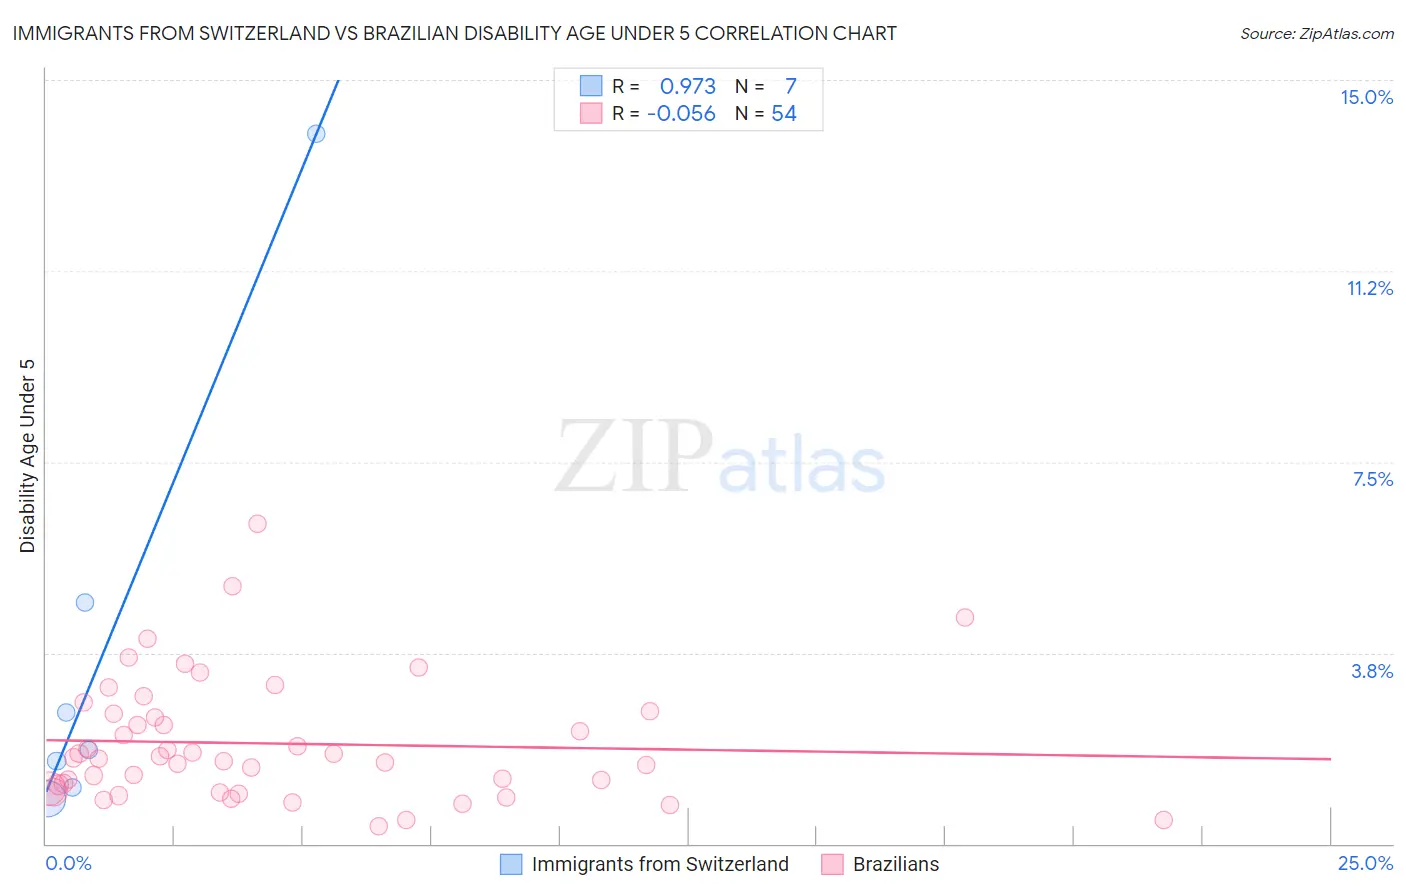
Immigrants from Switzerland vs Brazilian Disability Age Under 5 Correlation Chart

The statistical analysis conducted on geographies consisting of 99,521,676 people shows a perfect positive correlation between the proportion of Immigrants from Switzerland and percentage of population with a disability under the age of 5 in the United States with a correlation coefficient (R) of 0.973 and weighted average of 1.1%. Similarly, the statistical analysis conducted on geographies consisting of 185,712,155 people shows a slight negative correlation between the proportion of Brazilians and percentage of population with a disability under the age of 5 in the United States with a correlation coefficient (R) of -0.056 and weighted average of 1.5%, a difference of 31.6%.
Immigrants from Switzerland vs Brazilian Disability Age Under 5

Disability Age Under 5 Correlation Summary

MeasurementImmigrants from SwitzerlandBrazilian
Minimum0.89%0.34%
Maximum14.0%6.3%
Range13.1%6.0%
Mean3.8%2.0%
Median1.8%1.7%
Interquartile 25% (IQ1)1.1%1.1%
Interquartile 75% (IQ3)4.7%2.5%
Interquartile Range (IQR)3.6%1.5%
Standard Deviation (Sample)4.6%1.2%
Standard Deviation (Population)4.3%1.2%

Similar Demographics by Disability Age Under 5

Demographics Similar to Immigrants from Switzerland by Disability Age Under 5

In terms of disability age under 5, the demographic groups most similar to Immigrants from Switzerland are Immigrants from Ethiopia (1.1%, a difference of 0.010%), Immigrants from Western Asia (1.1%, a difference of 0.070%), Immigrants from Vietnam (1.1%, a difference of 0.11%), Egyptian (1.1%, a difference of 0.57%), and Immigrants from Malaysia (1.1%, a difference of 0.83%).
DemographicsRating | RankDisability Age Under 5
Salvadorans
99.5
/100
|
#55
Exceptional
1.1%
Ecuadorians
99.5
/100
|
#56
Exceptional
1.1%
Assyrians/Chaldeans/Syriacs
99.5
/100
|
#57
Exceptional
1.1%
Immigrants | Egypt
99.4
/100
|
#58
Exceptional
1.1%
Immigrants | Malaysia
99.4
/100
|
#59
Exceptional
1.1%
Immigrants | Western Asia
99.2
/100
|
#60
Exceptional
1.1%
Immigrants | Ethiopia
99.2
/100
|
#61
Exceptional
1.1%
Immigrants | Switzerland
99.2
/100
|
#62
Exceptional
1.1%
Immigrants | Vietnam
99.1
/100
|
#63
Exceptional
1.1%
Egyptians
98.9
/100
|
#64
Exceptional
1.1%
Immigrants | Korea
98.8
/100
|
#65
Exceptional
1.1%
Immigrants | Indonesia
98.7
/100
|
#66
Exceptional
1.1%
Immigrants | Belize
98.7
/100
|
#67
Exceptional
1.1%
South Africans
98.7
/100
|
#68
Exceptional
1.1%
Israelis
98.7
/100
|
#69
Exceptional
1.1%

Demographics Similar to Brazilians by Disability Age Under 5

In terms of disability age under 5, the demographic groups most similar to Brazilians are Iroquois (1.5%, a difference of 0.11%), Alaskan Athabascan (1.5%, a difference of 0.38%), Greek (1.5%, a difference of 0.57%), Black/African American (1.4%, a difference of 0.67%), and Immigrants from Canada (1.4%, a difference of 0.83%).
DemographicsRating | RankDisability Age Under 5
Belgians
0.1
/100
|
#268
Tragic
1.4%
Austrians
0.1
/100
|
#269
Tragic
1.4%
Immigrants | North America
0.1
/100
|
#270
Tragic
1.4%
Immigrants | Canada
0.1
/100
|
#271
Tragic
1.4%
Blacks/African Americans
0.1
/100
|
#272
Tragic
1.4%
Alaskan Athabascans
0.1
/100
|
#273
Tragic
1.5%
Iroquois
0.0
/100
|
#274
Tragic
1.5%
Brazilians
0.0
/100
|
#275
Tragic
1.5%
Greeks
0.0
/100
|
#276
Tragic
1.5%
Canadians
0.0
/100
|
#277
Tragic
1.5%
Kiowa
0.0
/100
|
#278
Tragic
1.5%
Danes
0.0
/100
|
#279
Tragic
1.5%
British
0.0
/100
|
#280
Tragic
1.5%
Czechoslovakians
0.0
/100
|
#281
Tragic
1.5%
Cheyenne
0.0
/100
|
#282
Tragic
1.5%