Immigrants from Scotland vs Cree Female Disability
COMPARE
Immigrants from Scotland
Cree
Female Disability
Female Disability Comparison
Immigrants from Scotland
Cree
12.0%
FEMALE DISABILITY
79.3/ 100
METRIC RATING
152nd/ 347
METRIC RANK
13.7%
FEMALE DISABILITY
0.0/ 100
METRIC RATING
308th/ 347
METRIC RANK
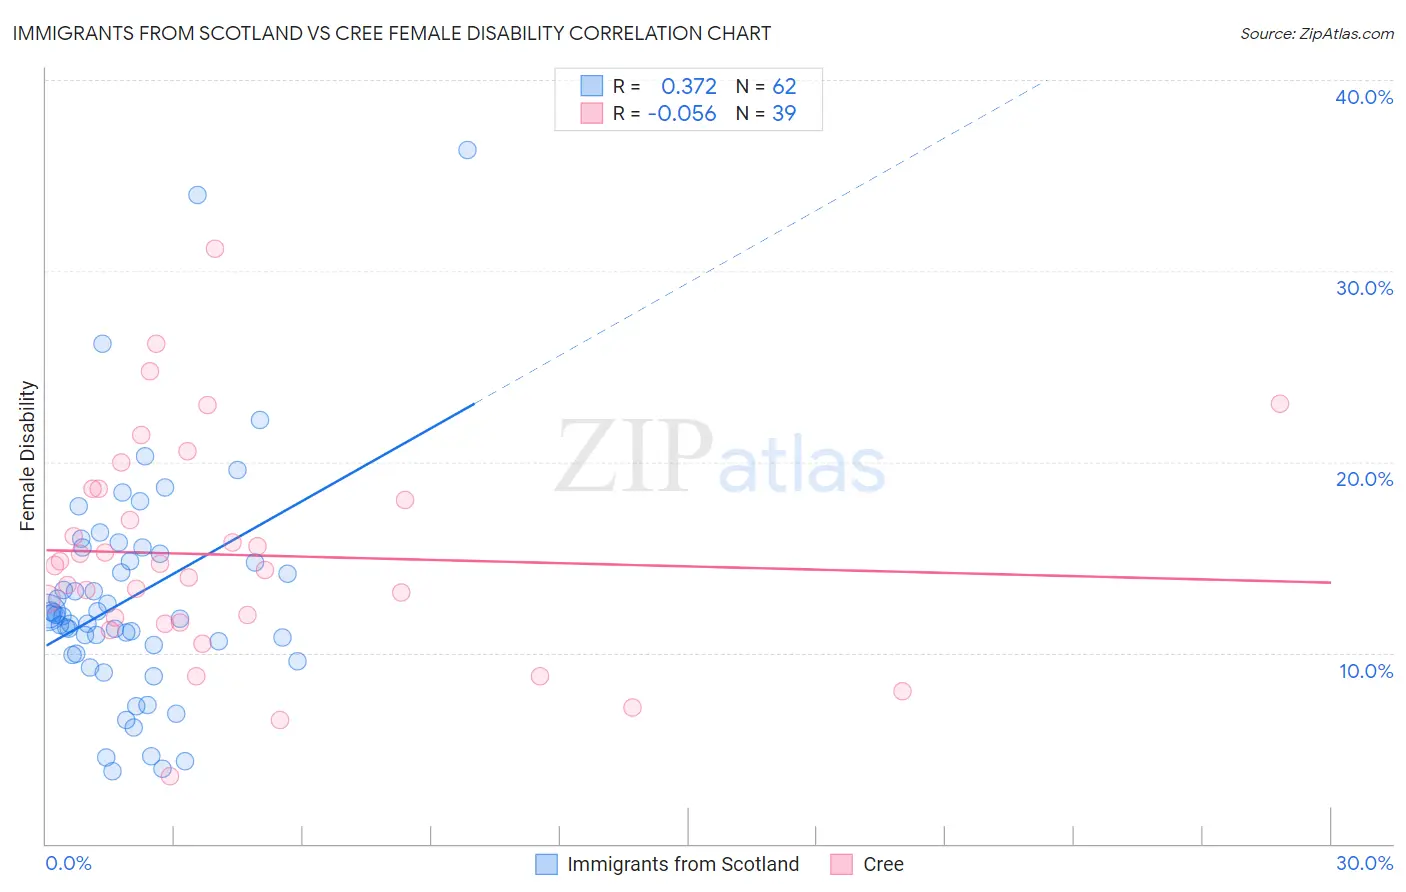
Immigrants from Scotland vs Cree Female Disability Correlation Chart
The statistical analysis conducted on geographies consisting of 196,394,283 people shows a mild positive correlation between the proportion of Immigrants from Scotland and percentage of females with a disability in the United States with a correlation coefficient (R) of 0.372 and weighted average of 12.0%. Similarly, the statistical analysis conducted on geographies consisting of 76,204,869 people shows a slight negative correlation between the proportion of Cree and percentage of females with a disability in the United States with a correlation coefficient (R) of -0.056 and weighted average of 13.7%, a difference of 13.6%.
Female Disability Correlation Summary
| Measurement | Immigrants from Scotland | Cree |
| Minimum | 3.8% | 3.6% |
| Maximum | 36.4% | 31.2% |
| Range | 32.6% | 27.6% |
| Mean | 12.9% | 15.1% |
| Median | 11.9% | 14.6% |
| Interquartile 25% (IQ1) | 9.9% | 11.6% |
| Interquartile 75% (IQ3) | 15.2% | 18.6% |
| Interquartile Range (IQR) | 5.3% | 7.0% |
| Standard Deviation (Sample) | 6.0% | 5.7% |
| Standard Deviation (Population) | 6.0% | 5.6% |
Similar Demographics by Female Disability
Demographics Similar to Immigrants from Scotland by Female Disability
In terms of female disability, the demographic groups most similar to Immigrants from Scotland are Sudanese (12.0%, a difference of 0.010%), Icelander (12.0%, a difference of 0.090%), Immigrants from Moldova (12.0%, a difference of 0.13%), Syrian (12.1%, a difference of 0.13%), and Ghanaian (12.1%, a difference of 0.15%).
| Demographics | Rating | Rank | Female Disability |
| Estonians | 87.8 /100 | #145 | Excellent 12.0% |
| Pakistanis | 84.6 /100 | #146 | Excellent 12.0% |
| Nigerians | 84.0 /100 | #147 | Excellent 12.0% |
| Immigrants | Kenya | 83.1 /100 | #148 | Excellent 12.0% |
| Greeks | 82.0 /100 | #149 | Excellent 12.0% |
| Immigrants | Moldova | 81.4 /100 | #150 | Excellent 12.0% |
| Icelanders | 80.7 /100 | #151 | Excellent 12.0% |
| Immigrants | Scotland | 79.3 /100 | #152 | Good 12.0% |
| Sudanese | 79.1 /100 | #153 | Good 12.0% |
| Syrians | 76.9 /100 | #154 | Good 12.1% |
| Ghanaians | 76.6 /100 | #155 | Good 12.1% |
| Moroccans | 72.9 /100 | #156 | Good 12.1% |
| Danes | 72.5 /100 | #157 | Good 12.1% |
| Immigrants | Middle Africa | 72.4 /100 | #158 | Good 12.1% |
| Immigrants | Central America | 67.7 /100 | #159 | Good 12.1% |
Demographics Similar to Cree by Female Disability
In terms of female disability, the demographic groups most similar to Cree are French American Indian (13.7%, a difference of 0.060%), Apache (13.7%, a difference of 0.18%), Central American Indian (13.6%, a difference of 0.46%), Hopi (13.7%, a difference of 0.46%), and French Canadian (13.6%, a difference of 0.75%).
| Demographics | Rating | Rank | Female Disability |
| Africans | 0.0 /100 | #301 | Tragic 13.4% |
| Scotch-Irish | 0.0 /100 | #302 | Tragic 13.4% |
| Immigrants | Portugal | 0.0 /100 | #303 | Tragic 13.5% |
| Immigrants | Micronesia | 0.0 /100 | #304 | Tragic 13.5% |
| Dominicans | 0.0 /100 | #305 | Tragic 13.5% |
| French Canadians | 0.0 /100 | #306 | Tragic 13.6% |
| Central American Indians | 0.0 /100 | #307 | Tragic 13.6% |
| Cree | 0.0 /100 | #308 | Tragic 13.7% |
| French American Indians | 0.0 /100 | #309 | Tragic 13.7% |
| Apache | 0.0 /100 | #310 | Tragic 13.7% |
| Hopi | 0.0 /100 | #311 | Tragic 13.7% |
| Delaware | 0.0 /100 | #312 | Tragic 13.8% |
| Blackfeet | 0.0 /100 | #313 | Tragic 13.8% |
| Puget Sound Salish | 0.0 /100 | #314 | Tragic 13.8% |
| Alaskan Athabascans | 0.0 /100 | #315 | Tragic 13.9% |