Immigrants from Kazakhstan vs Czech Self-Care Disability

COMPARE

Immigrants from Kazakhstan
Race
Ancestry
AfghanAfricanAlaska NativeAlaskan AthabascanAlbanianAleutAlsatianAmericanApacheArabArapahoArgentineanArmenianAssyrian/Chaldean/SyriacAustralianAustrianBahamianBangladeshiBarbadianBasqueBelgianBelizeanBermudanBhutaneseBlackfeetBolivianBrazilianBritishBritish West IndianBulgarianBurmeseCajunCambodianCanadianCape VerdeanCarpatho RusynCelticCentral AmericanCentral American IndianCherokeeCheyenneChickasawChileanChineseChippewaChoctawColombianColvilleComancheCosta RicanCreeCreekCroatianCrowCubanCypriotCzechoslovakianDanishDelawareDominicanDutchDutch West IndianEastern EuropeanEcuadorianEgyptianEnglishEstonianEthiopianEuropeanFijianFilipinoFinnishFrenchFrench American IndianFrench CanadianGermanGerman RussianGhanaianGreekGuamanian/ChamorroGuatemalanGuyaneseHaitianHmongHonduranHopiHoumaHungarianIcelanderIndian (Asian)IndonesianInupiatIranianIraqiIrishIroquoisIsraeliItalianJamaicanJapaneseJordanianKenyanKiowaKoreanLaotianLatvianLebaneseLiberianLithuanianLumbeeLuxembourgerMacedonianMalaysianMalteseMarshalleseMenomineeMexicanMexican American IndianMongolianMoroccanNative HawaiianNavajoNepaleseNew ZealanderNicaraguanNigerianNorthern EuropeanNorwegianOkinawanOsageOttawaPaiutePakistaniPalestinianPanamanianParaguayanPennsylvania GermanPeruvianPimaPolishPortuguesePotawatomiPuebloPuerto RicanPuget Sound SalishRomanianRussianSalvadoranSamoanScandinavianScotch-IrishScottishSeminoleSenegaleseSerbianShoshoneSierra LeoneanSiouxSlavicSlovakSloveneSomaliSouth AfricanSouth AmericanSouth American IndianSoviet UnionSpaniardSpanishSpanish AmericanSpanish American IndianSri LankanSubsaharan AfricanSudaneseSwedishSwissSyrianTaiwaneseThaiTlingit-HaidaTohono O'OdhamTonganTrinidadian and TobagonianTsimshianTurkishU.S. Virgin IslanderUgandanUkrainianUruguayanUteVenezuelanVietnameseWelshWest IndianYakamaYaquiYugoslavianYumanYup'ikZimbabwean
Immigration
NonimmigrantsImmigrantsAfghanistanAfricaAlbaniaArgentinaArmeniaAsiaAustraliaAustriaBahamasBangladeshBarbadosBelarusBelgiumBelizeBoliviaBosnia and HerzegovinaBrazilBulgariaBurma/MyanmarCabo VerdeCambodiaCameroonCanadaCaribbeanCentral AmericaChileChinaColombiaCongoCosta RicaCroatiaCubaCzechoslovakiaDenmarkDominicaDominican RepublicEastern AfricaEastern AsiaEastern EuropeEcuadorEgyptEl SalvadorEnglandEritreaEthiopiaEuropeFijiFranceGermanyGhanaGreeceGrenadaGuatemalaGuyanaHaitiHondurasHong KongHungaryIndiaIndonesiaIranIraqIrelandIsraelItalyJamaicaJapanJordanKazakhstanKenyaKoreaKuwaitLaosLatin AmericaLatviaLebanonLiberiaLithuaniaMalaysiaMexicoMicronesiaMiddle AfricaMoldovaMoroccoNepalNetherlandsNicaraguaNigeriaNorth AmericaNorth MacedoniaNorthern AfricaNorthern EuropeNorwayOceaniaPakistanPanamaPeruPhilippinesPolandPortugalRomaniaRussiaSaudi ArabiaScotlandSenegalSerbiaSierra LeoneSingaporeSomaliaSouth AfricaSouth AmericaSouth Central AsiaSouth Eastern AsiaSouthern EuropeSpainSri LankaSt. Vincent and the GrenadinesSudanSwedenSwitzerlandSyriaTaiwanThailandTrinidad and TobagoTurkeyUgandaUkraineUruguayUzbekistanVenezuelaVietnamWest IndiesWestern AfricaWestern AsiaWestern EuropeYemenZaireZimbabweAzores
Czech
Race
Ancestry
AfghanAfricanAlaska NativeAlaskan AthabascanAlbanianAleutAlsatianAmericanApacheArabArapahoArgentineanArmenianAssyrian/Chaldean/SyriacAustralianAustrianBahamianBangladeshiBarbadianBasqueBelgianBelizeanBermudanBhutaneseBlackfeetBolivianBrazilianBritishBritish West IndianBulgarianBurmeseCajunCambodianCanadianCape VerdeanCarpatho RusynCelticCentral AmericanCentral American IndianCherokeeCheyenneChickasawChileanChineseChippewaChoctawColombianColvilleComancheCosta RicanCreeCreekCroatianCrowCubanCypriotCzechCzechoslovakianDanishDelawareDominicanDutchDutch West IndianEastern EuropeanEcuadorianEgyptianEnglishEstonianEthiopianEuropeanFijianFilipinoFinnishFrenchFrench American IndianFrench CanadianGermanGerman RussianGhanaianGreekGuamanian/ChamorroGuatemalanGuyaneseHaitianHmongHonduranHopiHoumaHungarianIcelanderIndian (Asian)IndonesianInupiatIranianIraqiIrishIroquoisIsraeliItalianJamaicanJapaneseJordanianKenyanKiowaKoreanLaotianLatvianLebaneseLiberianLithuanianLumbeeLuxembourgerMacedonianMalaysianMalteseMarshalleseMenomineeMexicanMexican American IndianMongolianMoroccanNative HawaiianNavajoNepaleseNew ZealanderNicaraguanNigerianNorthern EuropeanNorwegianOkinawanOsageOttawaPaiutePakistaniPalestinianPanamanianParaguayanPennsylvania GermanPeruvianPimaPolishPortuguesePotawatomiPuebloPuerto RicanPuget Sound SalishRomanianRussianSalvadoranSamoanScandinavianScotch-IrishScottishSeminoleSenegaleseSerbianShoshoneSierra LeoneanSiouxSlavicSlovakSloveneSomaliSouth AfricanSouth AmericanSouth American IndianSoviet UnionSpaniardSpanishSpanish AmericanSpanish American IndianSri LankanSubsaharan AfricanSudaneseSwedishSwissSyrianTaiwaneseThaiTlingit-HaidaTohono O'OdhamTonganTrinidadian and TobagonianTsimshianTurkishU.S. Virgin IslanderUgandanUkrainianUruguayanUteVenezuelanVietnameseWelshWest IndianYakamaYaquiYugoslavianYumanYup'ikZimbabwean
Immigration
NonimmigrantsImmigrantsAfghanistanAfricaAlbaniaArgentinaArmeniaAsiaAustraliaAustriaBahamasBangladeshBarbadosBelarusBelgiumBelizeBoliviaBosnia and HerzegovinaBrazilBulgariaBurma/MyanmarCabo VerdeCambodiaCameroonCanadaCaribbeanCentral AmericaChileChinaColombiaCongoCosta RicaCroatiaCubaCzechoslovakiaDenmarkDominicaDominican RepublicEastern AfricaEastern AsiaEastern EuropeEcuadorEgyptEl SalvadorEnglandEritreaEthiopiaEuropeFijiFranceGermanyGhanaGreeceGrenadaGuatemalaGuyanaHaitiHondurasHong KongHungaryIndiaIndonesiaIranIraqIrelandIsraelItalyJamaicaJapanJordanKenyaKoreaKuwaitLaosLatin AmericaLatviaLebanonLiberiaLithuaniaMalaysiaMexicoMicronesiaMiddle AfricaMoldovaMoroccoNepalNetherlandsNicaraguaNigeriaNorth AmericaNorth MacedoniaNorthern AfricaNorthern EuropeNorwayOceaniaPakistanPanamaPeruPhilippinesPolandPortugalRomaniaRussiaSaudi ArabiaScotlandSenegalSerbiaSierra LeoneSingaporeSomaliaSouth AfricaSouth AmericaSouth Central AsiaSouth Eastern AsiaSouthern EuropeSpainSri LankaSt. Vincent and the GrenadinesSudanSwedenSwitzerlandSyriaTaiwanThailandTrinidad and TobagoTurkeyUgandaUkraineUruguayUzbekistanVenezuelaVietnamWest IndiesWestern AfricaWestern AsiaWestern EuropeYemenZaireZimbabweAzores
Self-Care Disability
Income
Poverty
Unemployment
Labor Participation
Family Structure
Vehicle Availability
Education Level
Disability

Self-Care Disability Comparison

Immigrants from Kazakhstan

Czechs

Average
Exceptional
2.5%
SELF-CARE DISABILITY
46.7/ 100
METRIC RATING
177th/ 347
METRIC RANK
2.3%
SELF-CARE DISABILITY
99.8/ 100
METRIC RATING
46th/ 347
METRIC RANK

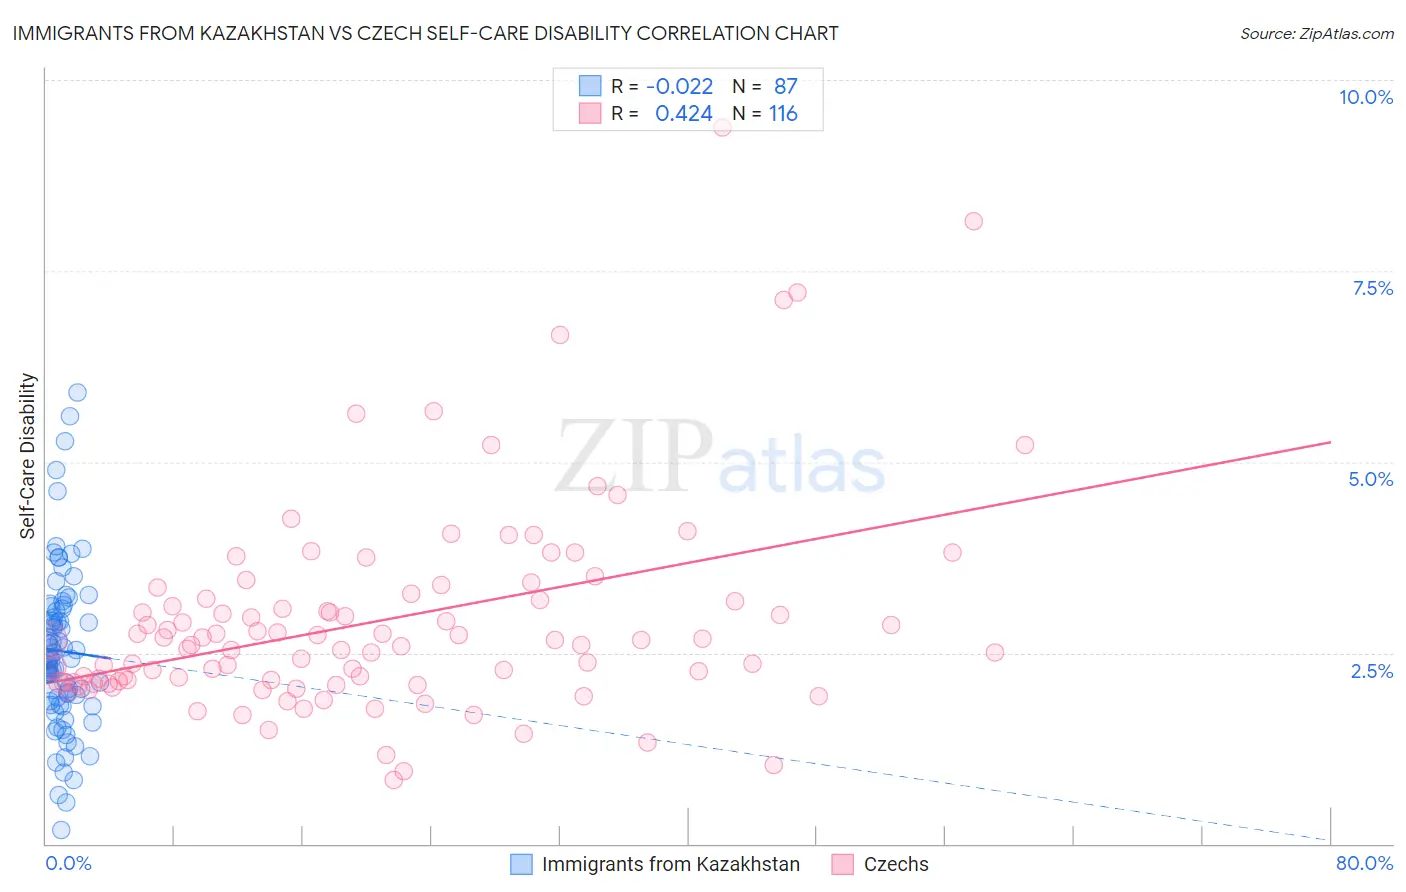
Immigrants from Kazakhstan vs Czech Self-Care Disability Correlation Chart

The statistical analysis conducted on geographies consisting of 124,334,513 people shows no correlation between the proportion of Immigrants from Kazakhstan and percentage of population with self-care disability in the United States with a correlation coefficient (R) of -0.022 and weighted average of 2.5%. Similarly, the statistical analysis conducted on geographies consisting of 483,678,458 people shows a moderate positive correlation between the proportion of Czechs and percentage of population with self-care disability in the United States with a correlation coefficient (R) of 0.424 and weighted average of 2.3%, a difference of 8.1%.
Immigrants from Kazakhstan vs Czech Self-Care Disability

Self-Care Disability Correlation Summary

MeasurementImmigrants from KazakhstanCzech
Minimum0.18%0.83%
Maximum5.9%9.4%
Range5.7%8.5%
Mean2.5%2.9%
Median2.4%2.6%
Interquartile 25% (IQ1)1.9%2.1%
Interquartile 75% (IQ3)3.1%3.2%
Interquartile Range (IQR)1.2%1.1%
Standard Deviation (Sample)1.1%1.4%
Standard Deviation (Population)1.1%1.4%

Similar Demographics by Self-Care Disability

Demographics Similar to Immigrants from Kazakhstan by Self-Care Disability

In terms of self-care disability, the demographic groups most similar to Immigrants from Kazakhstan are English (2.5%, a difference of 0.020%), Immigrants from Afghanistan (2.5%, a difference of 0.040%), Hungarian (2.5%, a difference of 0.060%), Immigrants from Bosnia and Herzegovina (2.5%, a difference of 0.14%), and Welsh (2.5%, a difference of 0.16%).
DemographicsRating | RankSelf-Care Disability
Scottish
54.3
/100
|
#170
Average
2.5%
Pennsylvania Germans
53.5
/100
|
#171
Average
2.5%
Czechoslovakians
53.5
/100
|
#172
Average
2.5%
Immigrants | Burma/Myanmar
52.8
/100
|
#173
Average
2.5%
Welsh
50.0
/100
|
#174
Average
2.5%
Immigrants | Bosnia and Herzegovina
49.6
/100
|
#175
Average
2.5%
Immigrants | Afghanistan
47.6
/100
|
#176
Average
2.5%
Immigrants | Kazakhstan
46.7
/100
|
#177
Average
2.5%
English
46.2
/100
|
#178
Average
2.5%
Hungarians
45.5
/100
|
#179
Average
2.5%
Indonesians
41.2
/100
|
#180
Average
2.5%
Ghanaians
40.4
/100
|
#181
Average
2.5%
Maltese
37.5
/100
|
#182
Fair
2.5%
Salvadorans
36.4
/100
|
#183
Fair
2.5%
Yugoslavians
36.1
/100
|
#184
Fair
2.5%

Demographics Similar to Czechs by Self-Care Disability

In terms of self-care disability, the demographic groups most similar to Czechs are Norwegian (2.3%, a difference of 0.080%), Immigrants from South Africa (2.3%, a difference of 0.13%), Immigrants from Pakistan (2.3%, a difference of 0.17%), Immigrants from Uganda (2.3%, a difference of 0.22%), and Jordanian (2.3%, a difference of 0.23%).
DemographicsRating | RankSelf-Care Disability
Immigrants | Bulgaria
99.8
/100
|
#39
Exceptional
2.3%
Iranians
99.8
/100
|
#40
Exceptional
2.3%
Immigrants | Sudan
99.8
/100
|
#41
Exceptional
2.3%
Immigrants | Uganda
99.8
/100
|
#42
Exceptional
2.3%
Immigrants | Pakistan
99.8
/100
|
#43
Exceptional
2.3%
Immigrants | South Africa
99.8
/100
|
#44
Exceptional
2.3%
Norwegians
99.8
/100
|
#45
Exceptional
2.3%
Czechs
99.8
/100
|
#46
Exceptional
2.3%
Jordanians
99.7
/100
|
#47
Exceptional
2.3%
Immigrants | Malaysia
99.7
/100
|
#48
Exceptional
2.3%
Latvians
99.7
/100
|
#49
Exceptional
2.3%
Immigrants | Brazil
99.7
/100
|
#50
Exceptional
2.3%
Kenyans
99.7
/100
|
#51
Exceptional
2.3%
Immigrants | Serbia
99.6
/100
|
#52
Exceptional
2.3%
Australians
99.6
/100
|
#53
Exceptional
2.3%