Immigrants from Honduras vs Scotch-Irish Male Disability
COMPARE
Immigrants from Honduras
Scotch-Irish
Male Disability
Male Disability Comparison
Immigrants from Honduras
Scotch-Irish
11.2%
MALE DISABILITY
48.7/ 100
METRIC RATING
175th/ 347
METRIC RANK
13.2%
MALE DISABILITY
0.0/ 100
METRIC RATING
303rd/ 347
METRIC RANK
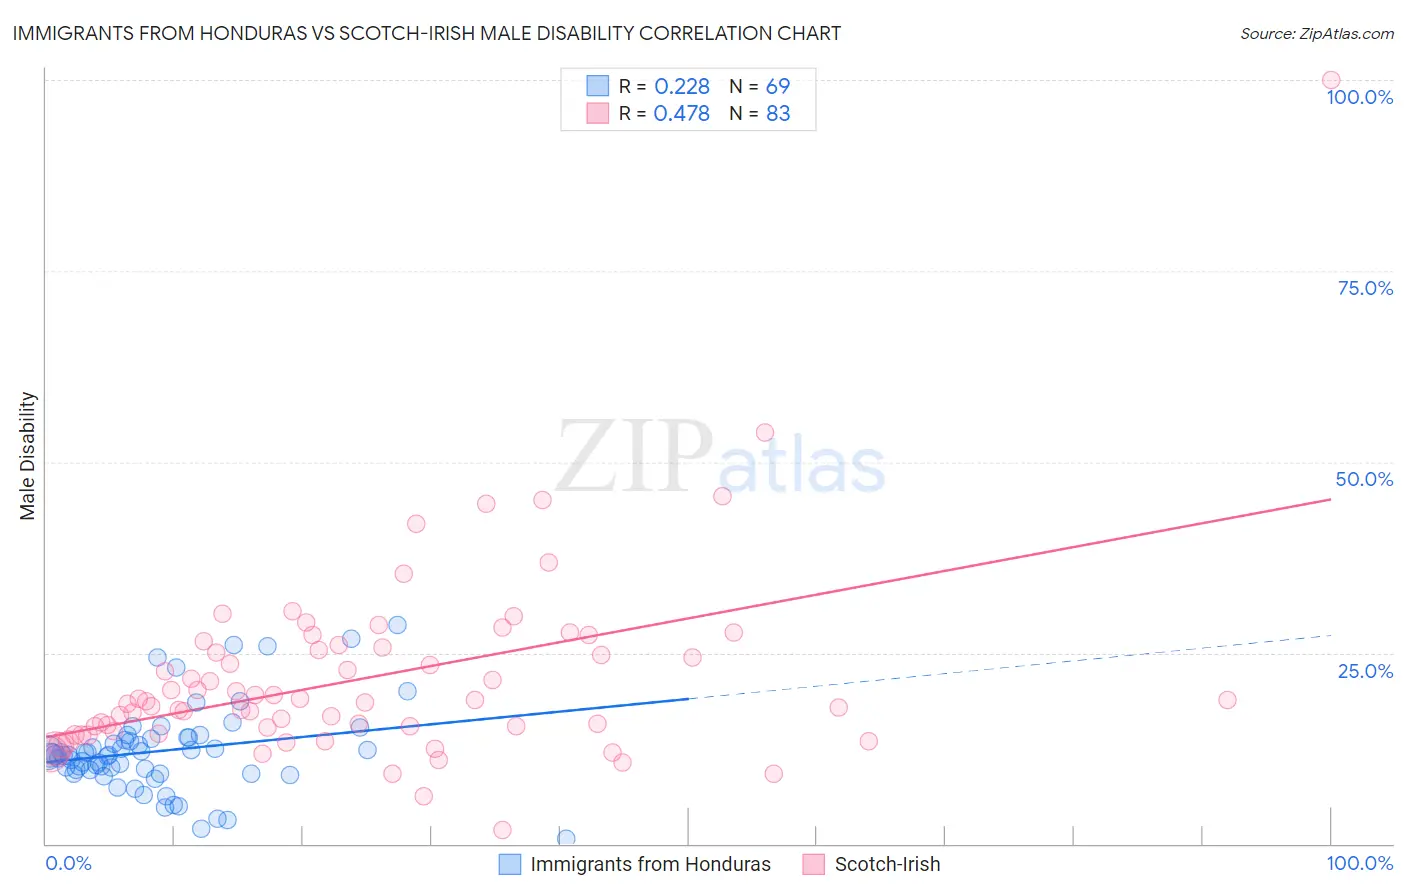
Immigrants from Honduras vs Scotch-Irish Male Disability Correlation Chart
The statistical analysis conducted on geographies consisting of 322,552,895 people shows a weak positive correlation between the proportion of Immigrants from Honduras and percentage of males with a disability in the United States with a correlation coefficient (R) of 0.228 and weighted average of 11.2%. Similarly, the statistical analysis conducted on geographies consisting of 548,574,277 people shows a moderate positive correlation between the proportion of Scotch-Irish and percentage of males with a disability in the United States with a correlation coefficient (R) of 0.478 and weighted average of 13.2%, a difference of 17.5%.
Male Disability Correlation Summary
| Measurement | Immigrants from Honduras | Scotch-Irish |
| Minimum | 0.65% | 1.8% |
| Maximum | 28.6% | 100.0% |
| Range | 27.9% | 98.2% |
| Mean | 12.2% | 21.6% |
| Median | 11.6% | 18.6% |
| Interquartile 25% (IQ1) | 9.4% | 14.8% |
| Interquartile 75% (IQ3) | 13.8% | 25.6% |
| Interquartile Range (IQR) | 4.4% | 10.9% |
| Standard Deviation (Sample) | 5.6% | 12.6% |
| Standard Deviation (Population) | 5.5% | 12.6% |
Similar Demographics by Male Disability
Demographics Similar to Immigrants from Honduras by Male Disability
In terms of male disability, the demographic groups most similar to Immigrants from Honduras are Maltese (11.2%, a difference of 0.070%), Immigrants from Burma/Myanmar (11.2%, a difference of 0.10%), Romanian (11.2%, a difference of 0.12%), Syrian (11.2%, a difference of 0.12%), and Haitian (11.2%, a difference of 0.21%).
| Demographics | Rating | Rank | Male Disability |
| Immigrants | Latin America | 54.0 /100 | #168 | Average 11.2% |
| Barbadians | 53.4 /100 | #169 | Average 11.2% |
| New Zealanders | 52.9 /100 | #170 | Average 11.2% |
| Haitians | 52.5 /100 | #171 | Average 11.2% |
| Romanians | 50.7 /100 | #172 | Average 11.2% |
| Immigrants | Burma/Myanmar | 50.4 /100 | #173 | Average 11.2% |
| Maltese | 50.0 /100 | #174 | Average 11.2% |
| Immigrants | Honduras | 48.7 /100 | #175 | Average 11.2% |
| Syrians | 46.6 /100 | #176 | Average 11.2% |
| Immigrants | Norway | 44.2 /100 | #177 | Average 11.3% |
| Australians | 42.2 /100 | #178 | Average 11.3% |
| Immigrants | Caribbean | 41.4 /100 | #179 | Average 11.3% |
| Hondurans | 41.1 /100 | #180 | Average 11.3% |
| Immigrants | Senegal | 34.4 /100 | #181 | Fair 11.3% |
| Immigrants | Belize | 33.7 /100 | #182 | Fair 11.3% |
Demographics Similar to Scotch-Irish by Male Disability
In terms of male disability, the demographic groups most similar to Scotch-Irish are Black/African American (13.2%, a difference of 0.32%), Crow (13.1%, a difference of 0.54%), French Canadian (13.3%, a difference of 0.74%), Spanish American (13.3%, a difference of 0.94%), and French (13.0%, a difference of 1.1%).
| Demographics | Rating | Rank | Male Disability |
| Immigrants | Nonimmigrants | 0.0 /100 | #296 | Tragic 12.9% |
| Inupiat | 0.0 /100 | #297 | Tragic 13.0% |
| Pennsylvania Germans | 0.0 /100 | #298 | Tragic 13.0% |
| Celtics | 0.0 /100 | #299 | Tragic 13.0% |
| Cheyenne | 0.0 /100 | #300 | Tragic 13.0% |
| French | 0.0 /100 | #301 | Tragic 13.0% |
| Crow | 0.0 /100 | #302 | Tragic 13.1% |
| Scotch-Irish | 0.0 /100 | #303 | Tragic 13.2% |
| Blacks/African Americans | 0.0 /100 | #304 | Tragic 13.2% |
| French Canadians | 0.0 /100 | #305 | Tragic 13.3% |
| Spanish Americans | 0.0 /100 | #306 | Tragic 13.3% |
| Arapaho | 0.0 /100 | #307 | Tragic 13.3% |
| French American Indians | 0.0 /100 | #308 | Tragic 13.4% |
| Blackfeet | 0.0 /100 | #309 | Tragic 13.4% |
| Immigrants | Azores | 0.0 /100 | #310 | Tragic 13.4% |