Immigrants from Cabo Verde vs Immigrants from Asia Self-Care Disability
COMPARE
Immigrants from Cabo Verde
Immigrants from Asia
Self-Care Disability
Self-Care Disability Comparison
Immigrants from Cabo Verde
Immigrants from Asia
3.1%
SELF-CARE DISABILITY
0.0/ 100
METRIC RATING
340th/ 347
METRIC RANK
2.4%
SELF-CARE DISABILITY
96.9/ 100
METRIC RATING
95th/ 347
METRIC RANK
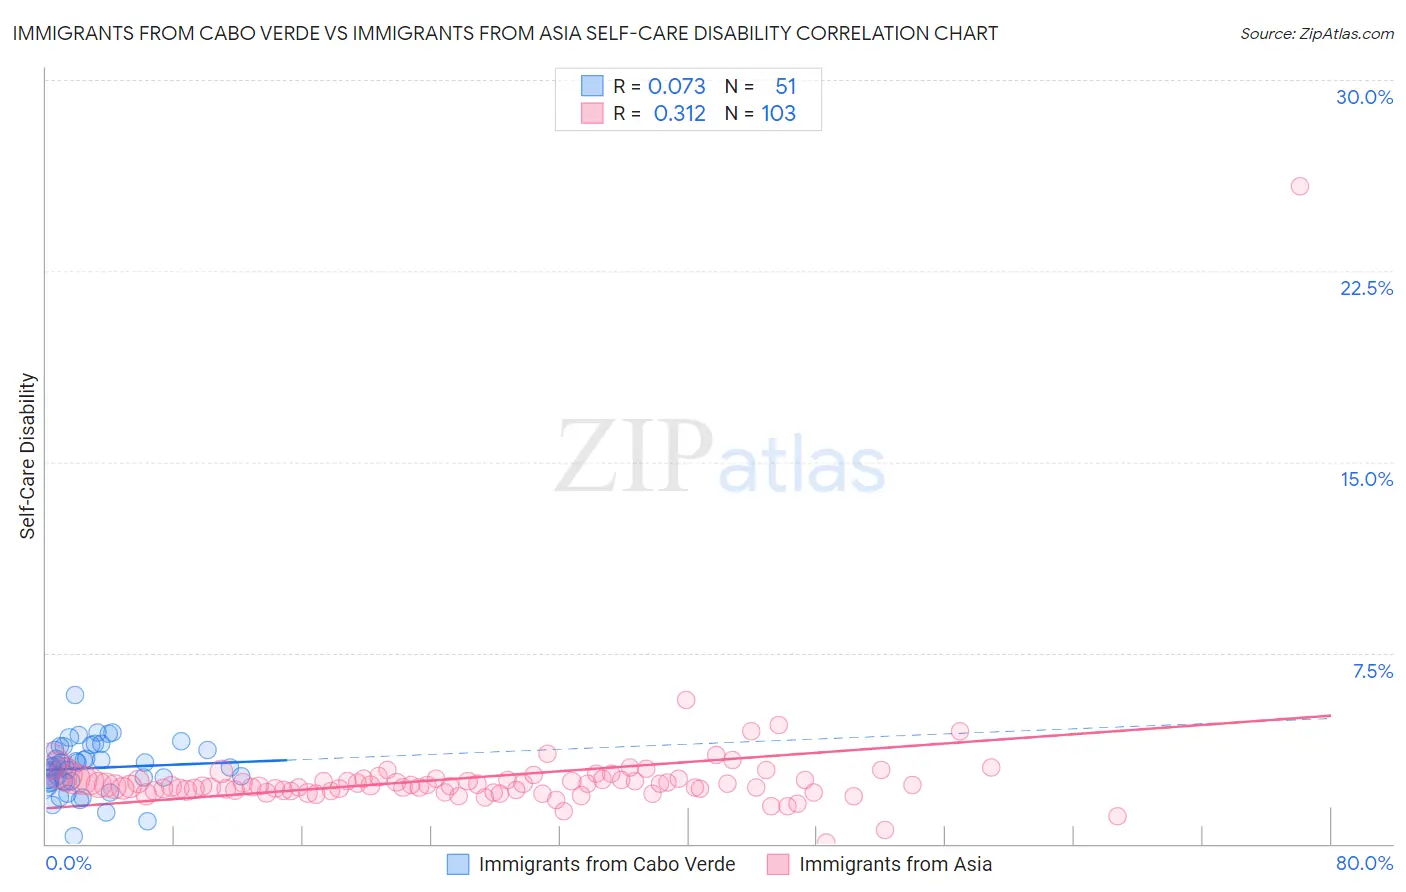
Immigrants from Cabo Verde vs Immigrants from Asia Self-Care Disability Correlation Chart
The statistical analysis conducted on geographies consisting of 38,125,014 people shows a slight positive correlation between the proportion of Immigrants from Cabo Verde and percentage of population with self-care disability in the United States with a correlation coefficient (R) of 0.073 and weighted average of 3.1%. Similarly, the statistical analysis conducted on geographies consisting of 547,490,821 people shows a mild positive correlation between the proportion of Immigrants from Asia and percentage of population with self-care disability in the United States with a correlation coefficient (R) of 0.312 and weighted average of 2.4%, a difference of 29.1%.
Self-Care Disability Correlation Summary
| Measurement | Immigrants from Cabo Verde | Immigrants from Asia |
| Minimum | 0.30% | 0.037% |
| Maximum | 5.8% | 25.8% |
| Range | 5.5% | 25.8% |
| Mean | 3.0% | 2.6% |
| Median | 3.0% | 2.3% |
| Interquartile 25% (IQ1) | 2.4% | 2.1% |
| Interquartile 75% (IQ3) | 3.7% | 2.5% |
| Interquartile Range (IQR) | 1.2% | 0.44% |
| Standard Deviation (Sample) | 1.00% | 2.4% |
| Standard Deviation (Population) | 0.99% | 2.4% |
Similar Demographics by Self-Care Disability
Demographics Similar to Immigrants from Cabo Verde by Self-Care Disability
In terms of self-care disability, the demographic groups most similar to Immigrants from Cabo Verde are Dominican (3.1%, a difference of 0.26%), Immigrants from Dominican Republic (3.0%, a difference of 0.33%), Cape Verdean (3.0%, a difference of 0.72%), Choctaw (3.0%, a difference of 1.0%), and Colville (3.1%, a difference of 1.9%).
| Demographics | Rating | Rank | Self-Care Disability |
| Dutch West Indians | 0.0 /100 | #333 | Tragic 3.0% |
| Houma | 0.0 /100 | #334 | Tragic 3.0% |
| Immigrants | Azores | 0.0 /100 | #335 | Tragic 3.0% |
| Immigrants | Yemen | 0.0 /100 | #336 | Tragic 3.0% |
| Choctaw | 0.0 /100 | #337 | Tragic 3.0% |
| Cape Verdeans | 0.0 /100 | #338 | Tragic 3.0% |
| Immigrants | Dominican Republic | 0.0 /100 | #339 | Tragic 3.0% |
| Immigrants | Cabo Verde | 0.0 /100 | #340 | Tragic 3.1% |
| Dominicans | 0.0 /100 | #341 | Tragic 3.1% |
| Colville | 0.0 /100 | #342 | Tragic 3.1% |
| Tohono O'odham | 0.0 /100 | #343 | Tragic 3.1% |
| Pueblo | 0.0 /100 | #344 | Tragic 3.3% |
| Armenians | 0.0 /100 | #345 | Tragic 3.4% |
| Puerto Ricans | 0.0 /100 | #346 | Tragic 3.7% |
| Immigrants | Armenia | 0.0 /100 | #347 | Tragic 4.2% |
Demographics Similar to Immigrants from Asia by Self-Care Disability
In terms of self-care disability, the demographic groups most similar to Immigrants from Asia are Macedonian (2.4%, a difference of 0.010%), Immigrants from Latvia (2.4%, a difference of 0.050%), Immigrants from Chile (2.4%, a difference of 0.060%), Swiss (2.4%, a difference of 0.10%), and Immigrants from Poland (2.4%, a difference of 0.19%).
| Demographics | Rating | Rank | Self-Care Disability |
| Lithuanians | 98.0 /100 | #88 | Exceptional 2.4% |
| Immigrants | Congo | 98.0 /100 | #89 | Exceptional 2.4% |
| Immigrants | Czechoslovakia | 97.7 /100 | #90 | Exceptional 2.4% |
| Immigrants | Jordan | 97.7 /100 | #91 | Exceptional 2.4% |
| Icelanders | 97.4 /100 | #92 | Exceptional 2.4% |
| Immigrants | Latvia | 97.0 /100 | #93 | Exceptional 2.4% |
| Macedonians | 96.9 /100 | #94 | Exceptional 2.4% |
| Immigrants | Asia | 96.9 /100 | #95 | Exceptional 2.4% |
| Immigrants | Chile | 96.7 /100 | #96 | Exceptional 2.4% |
| Swiss | 96.6 /100 | #97 | Exceptional 2.4% |
| Immigrants | Poland | 96.4 /100 | #98 | Exceptional 2.4% |
| Immigrants | Israel | 96.1 /100 | #99 | Exceptional 2.4% |
| Europeans | 95.8 /100 | #100 | Exceptional 2.4% |
| Immigrants | Scotland | 95.7 /100 | #101 | Exceptional 2.4% |
| Croatians | 95.0 /100 | #102 | Exceptional 2.4% |