Immigrants from Argentina vs Potawatomi Female Disability
COMPARE
Immigrants from Argentina
Potawatomi
Female Disability
Female Disability Comparison
Immigrants from Argentina
Potawatomi
11.0%
FEMALE DISABILITY
100.0/ 100
METRIC RATING
24th/ 347
METRIC RANK
14.1%
FEMALE DISABILITY
0.0/ 100
METRIC RATING
321st/ 347
METRIC RANK
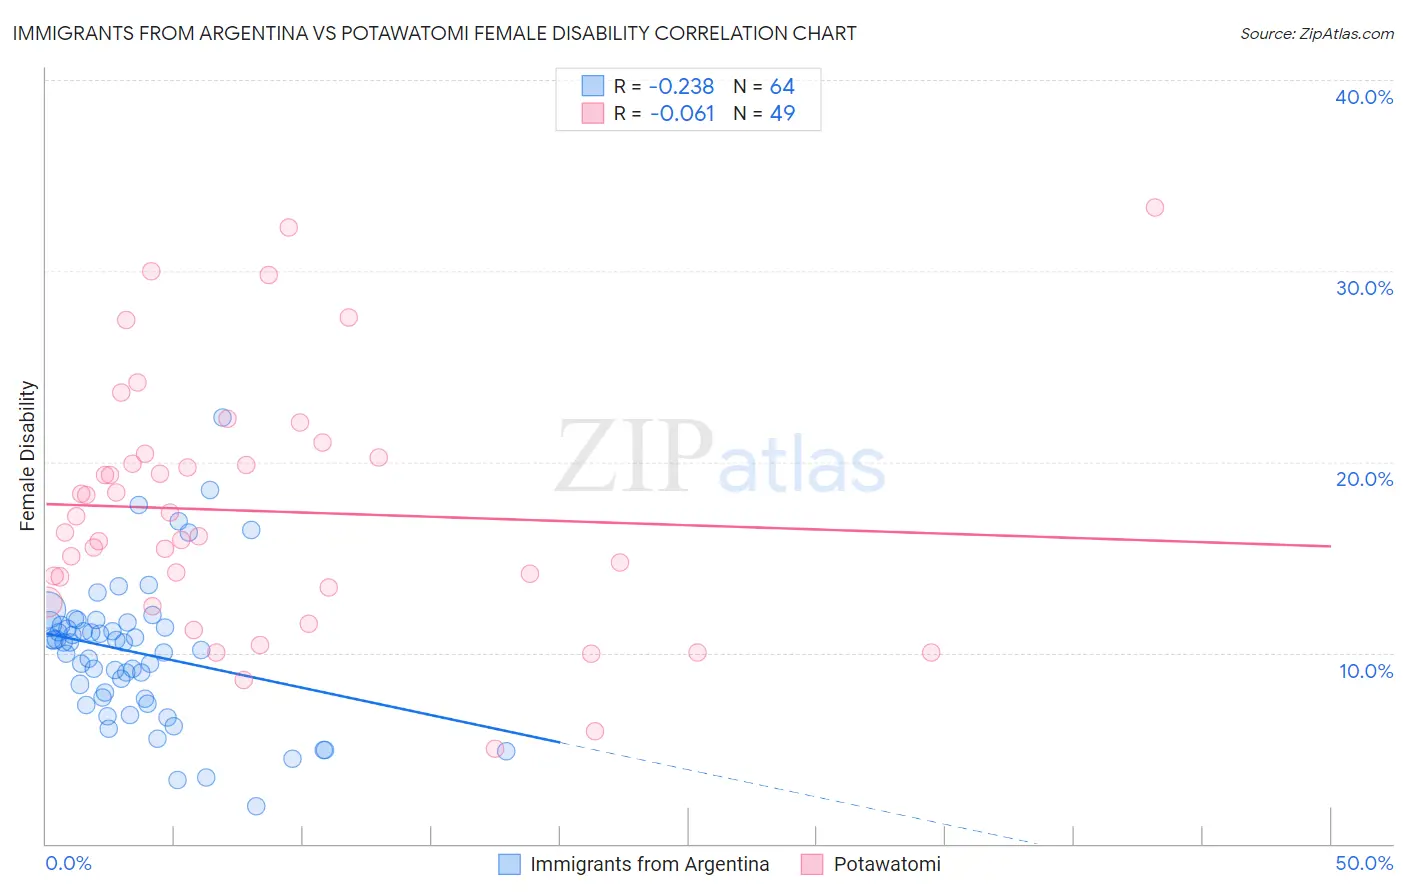
Immigrants from Argentina vs Potawatomi Female Disability Correlation Chart
The statistical analysis conducted on geographies consisting of 264,430,891 people shows a weak negative correlation between the proportion of Immigrants from Argentina and percentage of females with a disability in the United States with a correlation coefficient (R) of -0.238 and weighted average of 11.0%. Similarly, the statistical analysis conducted on geographies consisting of 117,767,381 people shows a slight negative correlation between the proportion of Potawatomi and percentage of females with a disability in the United States with a correlation coefficient (R) of -0.061 and weighted average of 14.1%, a difference of 28.2%.
Female Disability Correlation Summary
| Measurement | Immigrants from Argentina | Potawatomi |
| Minimum | 1.9% | 5.0% |
| Maximum | 22.3% | 33.3% |
| Range | 20.4% | 28.3% |
| Mean | 10.0% | 17.4% |
| Median | 10.6% | 16.3% |
| Interquartile 25% (IQ1) | 7.6% | 13.0% |
| Interquartile 75% (IQ3) | 11.5% | 20.3% |
| Interquartile Range (IQR) | 3.8% | 7.3% |
| Standard Deviation (Sample) | 3.7% | 6.5% |
| Standard Deviation (Population) | 3.7% | 6.4% |
Similar Demographics by Female Disability
Demographics Similar to Immigrants from Argentina by Female Disability
In terms of female disability, the demographic groups most similar to Immigrants from Argentina are Immigrants from Asia (11.0%, a difference of 0.030%), Argentinean (11.0%, a difference of 0.070%), Immigrants from Turkey (11.1%, a difference of 0.47%), Venezuelan (11.0%, a difference of 0.57%), and Egyptian (11.1%, a difference of 0.74%).
| Demographics | Rating | Rank | Female Disability |
| Indians (Asian) | 100.0 /100 | #17 | Exceptional 10.8% |
| Immigrants | Iran | 100.0 /100 | #18 | Exceptional 10.8% |
| Immigrants | Venezuela | 100.0 /100 | #19 | Exceptional 10.9% |
| Immigrants | Pakistan | 100.0 /100 | #20 | Exceptional 10.9% |
| Asians | 100.0 /100 | #21 | Exceptional 10.9% |
| Immigrants | Sri Lanka | 100.0 /100 | #22 | Exceptional 10.9% |
| Venezuelans | 100.0 /100 | #23 | Exceptional 11.0% |
| Immigrants | Argentina | 100.0 /100 | #24 | Exceptional 11.0% |
| Immigrants | Asia | 100.0 /100 | #25 | Exceptional 11.0% |
| Argentineans | 100.0 /100 | #26 | Exceptional 11.0% |
| Immigrants | Turkey | 100.0 /100 | #27 | Exceptional 11.1% |
| Egyptians | 100.0 /100 | #28 | Exceptional 11.1% |
| Immigrants | Malaysia | 100.0 /100 | #29 | Exceptional 11.1% |
| Turks | 100.0 /100 | #30 | Exceptional 11.1% |
| Immigrants | Kuwait | 100.0 /100 | #31 | Exceptional 11.1% |
Demographics Similar to Potawatomi by Female Disability
In terms of female disability, the demographic groups most similar to Potawatomi are Pueblo (14.1%, a difference of 0.010%), American (14.1%, a difference of 0.14%), Black/African American (14.1%, a difference of 0.18%), Native/Alaskan (14.1%, a difference of 0.20%), and Navajo (14.2%, a difference of 0.33%).
| Demographics | Rating | Rank | Female Disability |
| Puget Sound Salish | 0.0 /100 | #314 | Tragic 13.8% |
| Alaskan Athabascans | 0.0 /100 | #315 | Tragic 13.9% |
| Spanish Americans | 0.0 /100 | #316 | Tragic 14.0% |
| Chippewa | 0.0 /100 | #317 | Tragic 14.0% |
| Paiute | 0.0 /100 | #318 | Tragic 14.0% |
| Iroquois | 0.0 /100 | #319 | Tragic 14.0% |
| Americans | 0.0 /100 | #320 | Tragic 14.1% |
| Potawatomi | 0.0 /100 | #321 | Tragic 14.1% |
| Pueblo | 0.0 /100 | #322 | Tragic 14.1% |
| Blacks/African Americans | 0.0 /100 | #323 | Tragic 14.1% |
| Natives/Alaskans | 0.0 /100 | #324 | Tragic 14.1% |
| Navajo | 0.0 /100 | #325 | Tragic 14.2% |
| Comanche | 0.0 /100 | #326 | Tragic 14.2% |
| Ottawa | 0.0 /100 | #327 | Tragic 14.2% |
| Cape Verdeans | 0.0 /100 | #328 | Tragic 14.2% |