American vs Immigrants from Dominican Republic Female Disability
COMPARE
American
Immigrants from Dominican Republic
Female Disability
Female Disability Comparison
Americans
Immigrants from Dominican Republic
14.1%
FEMALE DISABILITY
0.0/ 100
METRIC RATING
320th/ 347
METRIC RANK
13.4%
FEMALE DISABILITY
0.0/ 100
METRIC RATING
299th/ 347
METRIC RANK
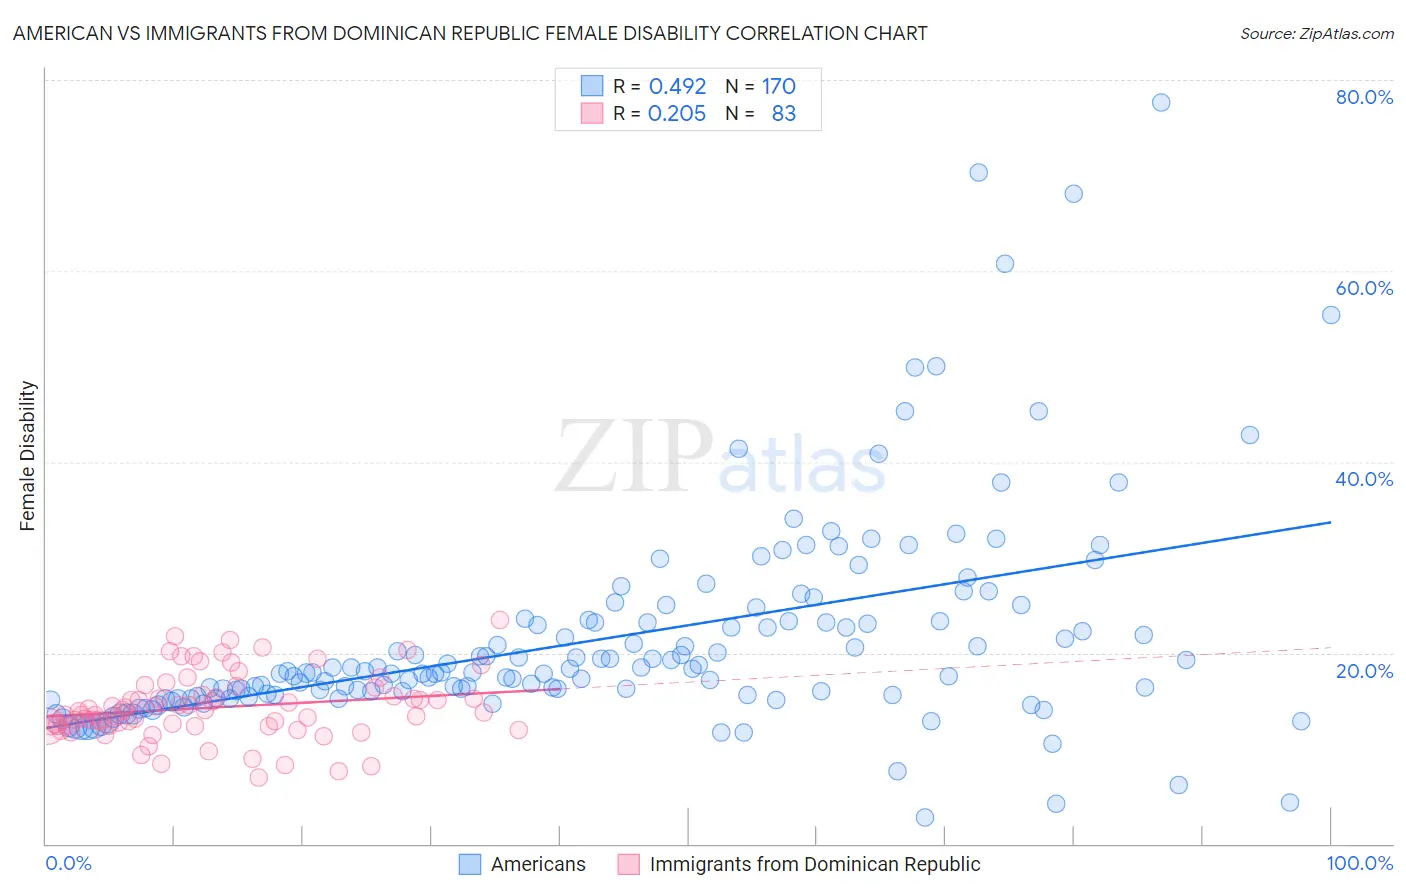
American vs Immigrants from Dominican Republic Female Disability Correlation Chart
The statistical analysis conducted on geographies consisting of 581,542,152 people shows a moderate positive correlation between the proportion of Americans and percentage of females with a disability in the United States with a correlation coefficient (R) of 0.492 and weighted average of 14.1%. Similarly, the statistical analysis conducted on geographies consisting of 275,087,890 people shows a weak positive correlation between the proportion of Immigrants from Dominican Republic and percentage of females with a disability in the United States with a correlation coefficient (R) of 0.205 and weighted average of 13.4%, a difference of 5.2%.
Female Disability Correlation Summary
| Measurement | American | Immigrants from Dominican Republic |
| Minimum | 2.7% | 7.0% |
| Maximum | 77.6% | 23.4% |
| Range | 74.9% | 16.4% |
| Mean | 21.4% | 14.3% |
| Median | 17.9% | 13.7% |
| Interquartile 25% (IQ1) | 15.4% | 12.3% |
| Interquartile 75% (IQ3) | 23.3% | 15.6% |
| Interquartile Range (IQR) | 7.9% | 3.3% |
| Standard Deviation (Sample) | 11.3% | 3.4% |
| Standard Deviation (Population) | 11.2% | 3.4% |
Similar Demographics by Female Disability
Demographics Similar to Americans by Female Disability
In terms of female disability, the demographic groups most similar to Americans are Potawatomi (14.1%, a difference of 0.14%), Pueblo (14.1%, a difference of 0.15%), Black/African American (14.1%, a difference of 0.31%), Native/Alaskan (14.1%, a difference of 0.33%), and Iroquois (14.0%, a difference of 0.34%).
| Demographics | Rating | Rank | Female Disability |
| Blackfeet | 0.0 /100 | #313 | Tragic 13.8% |
| Puget Sound Salish | 0.0 /100 | #314 | Tragic 13.8% |
| Alaskan Athabascans | 0.0 /100 | #315 | Tragic 13.9% |
| Spanish Americans | 0.0 /100 | #316 | Tragic 14.0% |
| Chippewa | 0.0 /100 | #317 | Tragic 14.0% |
| Paiute | 0.0 /100 | #318 | Tragic 14.0% |
| Iroquois | 0.0 /100 | #319 | Tragic 14.0% |
| Americans | 0.0 /100 | #320 | Tragic 14.1% |
| Potawatomi | 0.0 /100 | #321 | Tragic 14.1% |
| Pueblo | 0.0 /100 | #322 | Tragic 14.1% |
| Blacks/African Americans | 0.0 /100 | #323 | Tragic 14.1% |
| Natives/Alaskans | 0.0 /100 | #324 | Tragic 14.1% |
| Navajo | 0.0 /100 | #325 | Tragic 14.2% |
| Comanche | 0.0 /100 | #326 | Tragic 14.2% |
| Ottawa | 0.0 /100 | #327 | Tragic 14.2% |
Demographics Similar to Immigrants from Dominican Republic by Female Disability
In terms of female disability, the demographic groups most similar to Immigrants from Dominican Republic are Pennsylvania German (13.4%, a difference of 0.010%), African (13.4%, a difference of 0.21%), Nonimmigrants (13.4%, a difference of 0.26%), Scotch-Irish (13.4%, a difference of 0.35%), and Immigrants from Portugal (13.5%, a difference of 0.35%).
| Demographics | Rating | Rank | Female Disability |
| Yakama | 0.0 /100 | #292 | Tragic 13.2% |
| Marshallese | 0.0 /100 | #293 | Tragic 13.3% |
| Celtics | 0.0 /100 | #294 | Tragic 13.3% |
| French | 0.0 /100 | #295 | Tragic 13.3% |
| Nepalese | 0.0 /100 | #296 | Tragic 13.3% |
| Slovaks | 0.0 /100 | #297 | Tragic 13.3% |
| Immigrants | Nonimmigrants | 0.0 /100 | #298 | Tragic 13.4% |
| Immigrants | Dominican Republic | 0.0 /100 | #299 | Tragic 13.4% |
| Pennsylvania Germans | 0.0 /100 | #300 | Tragic 13.4% |
| Africans | 0.0 /100 | #301 | Tragic 13.4% |
| Scotch-Irish | 0.0 /100 | #302 | Tragic 13.4% |
| Immigrants | Portugal | 0.0 /100 | #303 | Tragic 13.5% |
| Immigrants | Micronesia | 0.0 /100 | #304 | Tragic 13.5% |
| Dominicans | 0.0 /100 | #305 | Tragic 13.5% |
| French Canadians | 0.0 /100 | #306 | Tragic 13.6% |