Barbadian vs Swedish Male Disability
COMPARE
Barbadian
Swedish
Male Disability
Male Disability Comparison
Barbadians
Swedes
11.2%
MALE DISABILITY
53.4/ 100
METRIC RATING
169th/ 347
METRIC RANK
12.1%
MALE DISABILITY
0.3/ 100
METRIC RATING
260th/ 347
METRIC RANK
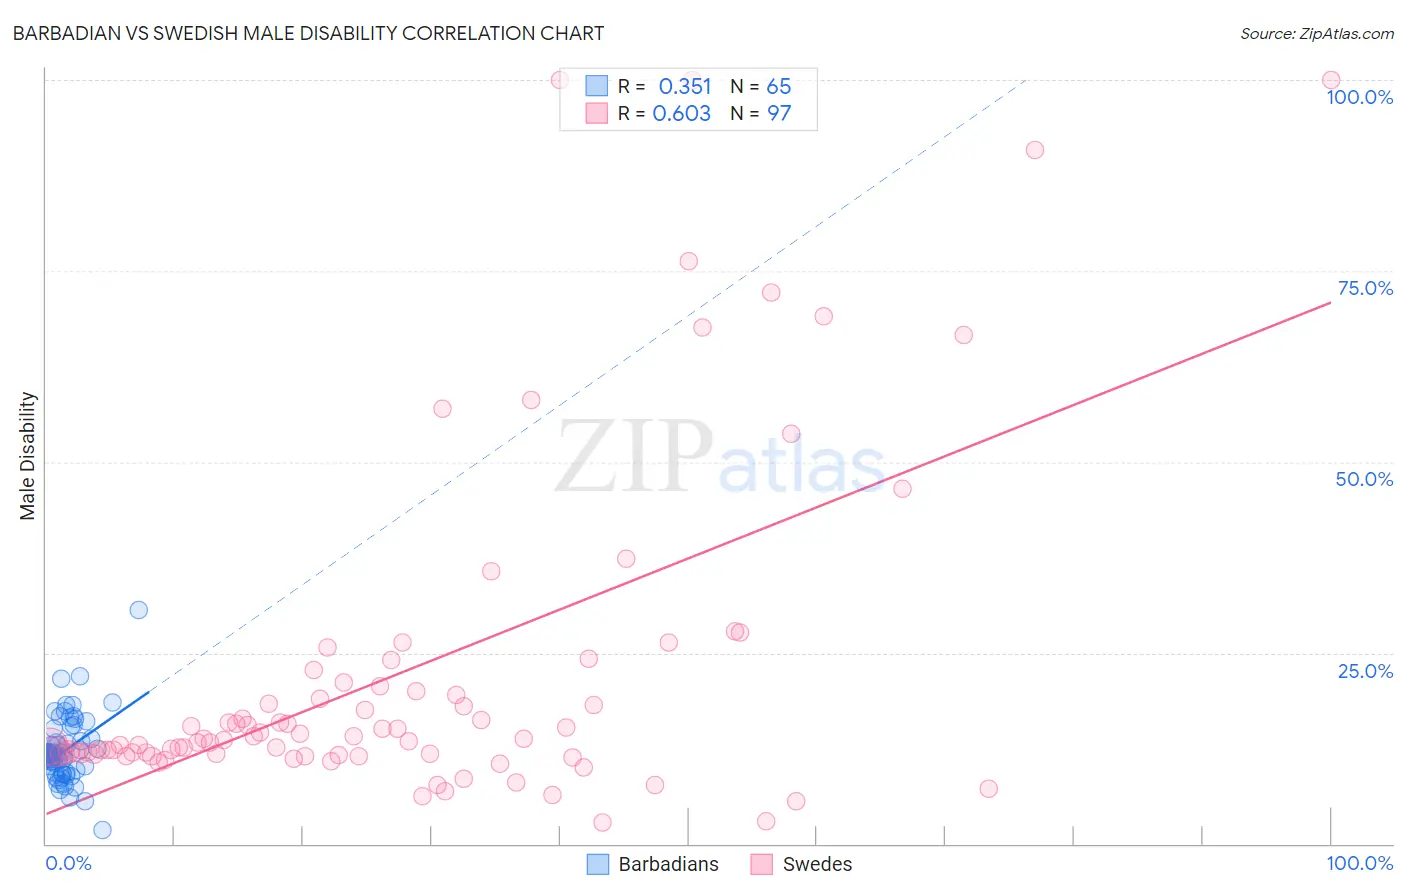
Barbadian vs Swedish Male Disability Correlation Chart
The statistical analysis conducted on geographies consisting of 141,288,845 people shows a mild positive correlation between the proportion of Barbadians and percentage of males with a disability in the United States with a correlation coefficient (R) of 0.351 and weighted average of 11.2%. Similarly, the statistical analysis conducted on geographies consisting of 539,057,565 people shows a significant positive correlation between the proportion of Swedes and percentage of males with a disability in the United States with a correlation coefficient (R) of 0.603 and weighted average of 12.1%, a difference of 8.4%.
Male Disability Correlation Summary
| Measurement | Barbadian | Swedish |
| Minimum | 1.8% | 2.9% |
| Maximum | 30.6% | 100.0% |
| Range | 28.8% | 97.1% |
| Mean | 12.3% | 22.4% |
| Median | 11.6% | 13.7% |
| Interquartile 25% (IQ1) | 9.3% | 11.7% |
| Interquartile 75% (IQ3) | 14.4% | 20.8% |
| Interquartile Range (IQR) | 5.1% | 9.1% |
| Standard Deviation (Sample) | 4.4% | 22.1% |
| Standard Deviation (Population) | 4.4% | 22.0% |
Similar Demographics by Male Disability
Demographics Similar to Barbadians by Male Disability
In terms of male disability, the demographic groups most similar to Barbadians are Immigrants from Latin America (11.2%, a difference of 0.030%), New Zealander (11.2%, a difference of 0.030%), Haitian (11.2%, a difference of 0.050%), Immigrants from Southern Europe (11.2%, a difference of 0.060%), and Romanian (11.2%, a difference of 0.15%).
| Demographics | Rating | Rank | Male Disability |
| Immigrants | Haiti | 65.3 /100 | #162 | Good 11.1% |
| Immigrants | Kenya | 63.8 /100 | #163 | Good 11.1% |
| British West Indians | 62.8 /100 | #164 | Good 11.1% |
| Luxembourgers | 61.9 /100 | #165 | Good 11.1% |
| Immigrants | Hungary | 61.2 /100 | #166 | Good 11.1% |
| Immigrants | Southern Europe | 54.4 /100 | #167 | Average 11.2% |
| Immigrants | Latin America | 54.0 /100 | #168 | Average 11.2% |
| Barbadians | 53.4 /100 | #169 | Average 11.2% |
| New Zealanders | 52.9 /100 | #170 | Average 11.2% |
| Haitians | 52.5 /100 | #171 | Average 11.2% |
| Romanians | 50.7 /100 | #172 | Average 11.2% |
| Immigrants | Burma/Myanmar | 50.4 /100 | #173 | Average 11.2% |
| Maltese | 50.0 /100 | #174 | Average 11.2% |
| Immigrants | Honduras | 48.7 /100 | #175 | Average 11.2% |
| Syrians | 46.6 /100 | #176 | Average 11.2% |
Demographics Similar to Swedes by Male Disability
In terms of male disability, the demographic groups most similar to Swedes are Belgian (12.1%, a difference of 0.070%), Basque (12.1%, a difference of 0.12%), Swiss (12.1%, a difference of 0.31%), European (12.1%, a difference of 0.31%), and Slavic (12.2%, a difference of 0.36%).
| Demographics | Rating | Rank | Male Disability |
| Guamanians/Chamorros | 0.5 /100 | #253 | Tragic 12.0% |
| British | 0.4 /100 | #254 | Tragic 12.1% |
| Chinese | 0.4 /100 | #255 | Tragic 12.1% |
| Swiss | 0.3 /100 | #256 | Tragic 12.1% |
| Europeans | 0.3 /100 | #257 | Tragic 12.1% |
| Basques | 0.3 /100 | #258 | Tragic 12.1% |
| Belgians | 0.3 /100 | #259 | Tragic 12.1% |
| Swedes | 0.3 /100 | #260 | Tragic 12.1% |
| Slavs | 0.2 /100 | #261 | Tragic 12.2% |
| Norwegians | 0.2 /100 | #262 | Tragic 12.2% |
| Canadians | 0.2 /100 | #263 | Tragic 12.2% |
| Nepalese | 0.2 /100 | #264 | Tragic 12.2% |
| Immigrants | Portugal | 0.1 /100 | #265 | Tragic 12.3% |
| Hawaiians | 0.1 /100 | #266 | Tragic 12.3% |
| Immigrants | Germany | 0.1 /100 | #267 | Tragic 12.3% |