Barbadian vs Alaskan Athabascan Male Disability
COMPARE
Barbadian
Alaskan Athabascan
Male Disability
Male Disability Comparison
Barbadians
Alaskan Athabascans
11.2%
MALE DISABILITY
53.4/ 100
METRIC RATING
169th/ 347
METRIC RANK
14.9%
MALE DISABILITY
0.0/ 100
METRIC RATING
336th/ 347
METRIC RANK
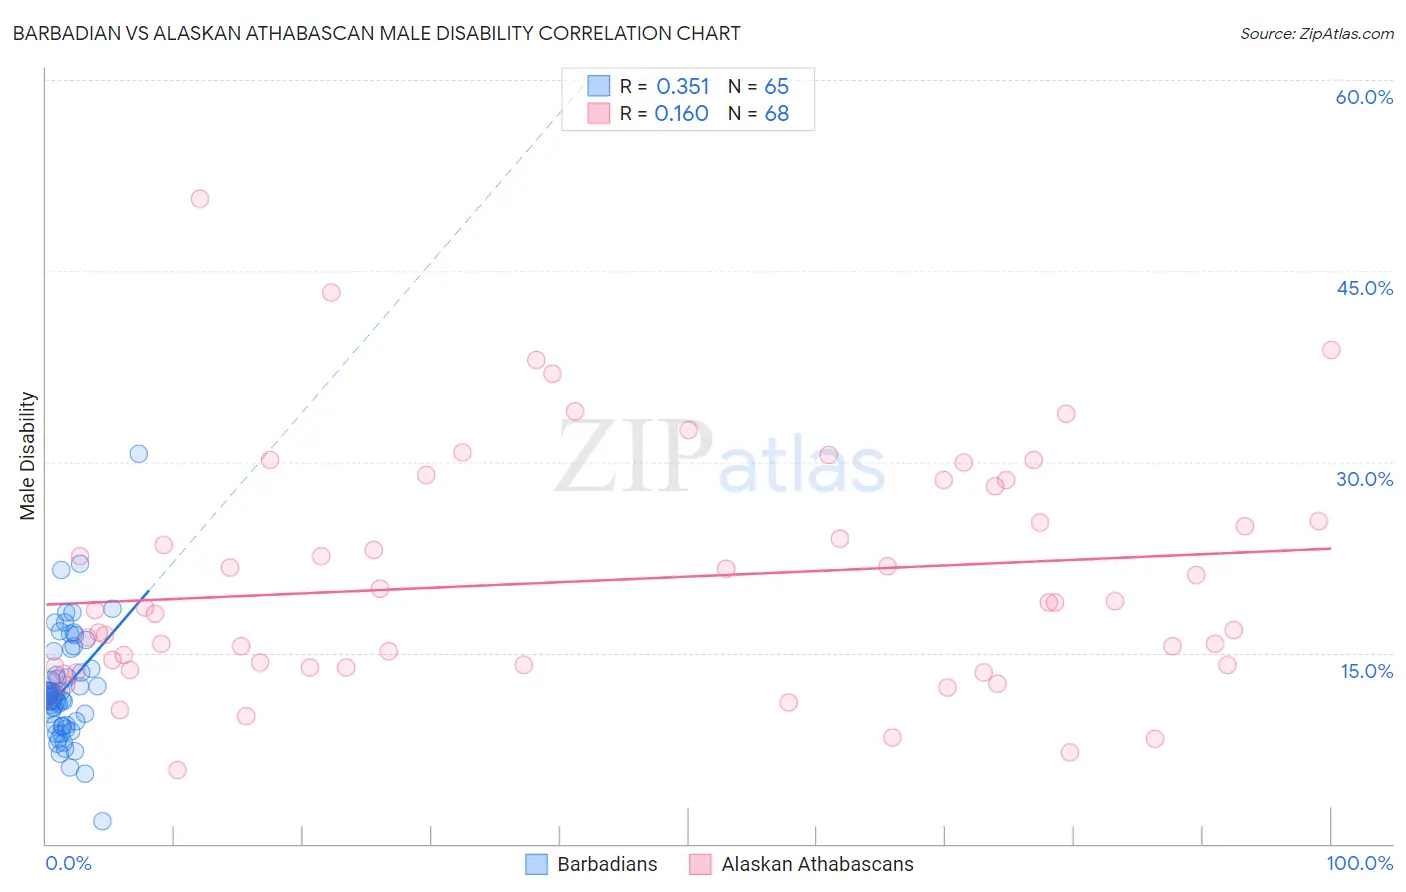
Barbadian vs Alaskan Athabascan Male Disability Correlation Chart
The statistical analysis conducted on geographies consisting of 141,288,845 people shows a mild positive correlation between the proportion of Barbadians and percentage of males with a disability in the United States with a correlation coefficient (R) of 0.351 and weighted average of 11.2%. Similarly, the statistical analysis conducted on geographies consisting of 45,820,726 people shows a poor positive correlation between the proportion of Alaskan Athabascans and percentage of males with a disability in the United States with a correlation coefficient (R) of 0.160 and weighted average of 14.9%, a difference of 33.2%.
Male Disability Correlation Summary
| Measurement | Barbadian | Alaskan Athabascan |
| Minimum | 1.8% | 5.8% |
| Maximum | 30.6% | 50.7% |
| Range | 28.8% | 44.9% |
| Mean | 12.3% | 20.7% |
| Median | 11.6% | 18.5% |
| Interquartile 25% (IQ1) | 9.3% | 13.9% |
| Interquartile 75% (IQ3) | 14.4% | 26.7% |
| Interquartile Range (IQR) | 5.1% | 12.8% |
| Standard Deviation (Sample) | 4.4% | 9.2% |
| Standard Deviation (Population) | 4.4% | 9.1% |
Similar Demographics by Male Disability
Demographics Similar to Barbadians by Male Disability
In terms of male disability, the demographic groups most similar to Barbadians are Immigrants from Latin America (11.2%, a difference of 0.030%), New Zealander (11.2%, a difference of 0.030%), Haitian (11.2%, a difference of 0.050%), Immigrants from Southern Europe (11.2%, a difference of 0.060%), and Romanian (11.2%, a difference of 0.15%).
| Demographics | Rating | Rank | Male Disability |
| Immigrants | Haiti | 65.3 /100 | #162 | Good 11.1% |
| Immigrants | Kenya | 63.8 /100 | #163 | Good 11.1% |
| British West Indians | 62.8 /100 | #164 | Good 11.1% |
| Luxembourgers | 61.9 /100 | #165 | Good 11.1% |
| Immigrants | Hungary | 61.2 /100 | #166 | Good 11.1% |
| Immigrants | Southern Europe | 54.4 /100 | #167 | Average 11.2% |
| Immigrants | Latin America | 54.0 /100 | #168 | Average 11.2% |
| Barbadians | 53.4 /100 | #169 | Average 11.2% |
| New Zealanders | 52.9 /100 | #170 | Average 11.2% |
| Haitians | 52.5 /100 | #171 | Average 11.2% |
| Romanians | 50.7 /100 | #172 | Average 11.2% |
| Immigrants | Burma/Myanmar | 50.4 /100 | #173 | Average 11.2% |
| Maltese | 50.0 /100 | #174 | Average 11.2% |
| Immigrants | Honduras | 48.7 /100 | #175 | Average 11.2% |
| Syrians | 46.6 /100 | #176 | Average 11.2% |
Demographics Similar to Alaskan Athabascans by Male Disability
In terms of male disability, the demographic groups most similar to Alaskan Athabascans are Dutch West Indian (14.8%, a difference of 0.46%), Cherokee (14.8%, a difference of 0.49%), Menominee (15.0%, a difference of 0.51%), Pueblo (15.0%, a difference of 0.62%), and Yuman (14.7%, a difference of 1.2%).
| Demographics | Rating | Rank | Male Disability |
| Cajuns | 0.0 /100 | #329 | Tragic 14.4% |
| Navajo | 0.0 /100 | #330 | Tragic 14.4% |
| Tohono O'odham | 0.0 /100 | #331 | Tragic 14.6% |
| Seminole | 0.0 /100 | #332 | Tragic 14.7% |
| Yuman | 0.0 /100 | #333 | Tragic 14.7% |
| Cherokee | 0.0 /100 | #334 | Tragic 14.8% |
| Dutch West Indians | 0.0 /100 | #335 | Tragic 14.8% |
| Alaskan Athabascans | 0.0 /100 | #336 | Tragic 14.9% |
| Menominee | 0.0 /100 | #337 | Tragic 15.0% |
| Pueblo | 0.0 /100 | #338 | Tragic 15.0% |
| Chickasaw | 0.0 /100 | #339 | Tragic 15.1% |
| Lumbee | 0.0 /100 | #340 | Tragic 15.2% |
| Choctaw | 0.0 /100 | #341 | Tragic 15.4% |
| Kiowa | 0.0 /100 | #342 | Tragic 15.4% |
| Creek | 0.0 /100 | #343 | Tragic 15.5% |