Barbadian vs Swedish Self-Care Disability
COMPARE
Barbadian
Swedish
Self-Care Disability
Self-Care Disability Comparison
Barbadians
Swedes
2.7%
SELF-CARE DISABILITY
0.0/ 100
METRIC RATING
295th/ 347
METRIC RANK
2.3%
SELF-CARE DISABILITY
99.3/ 100
METRIC RATING
64th/ 347
METRIC RANK
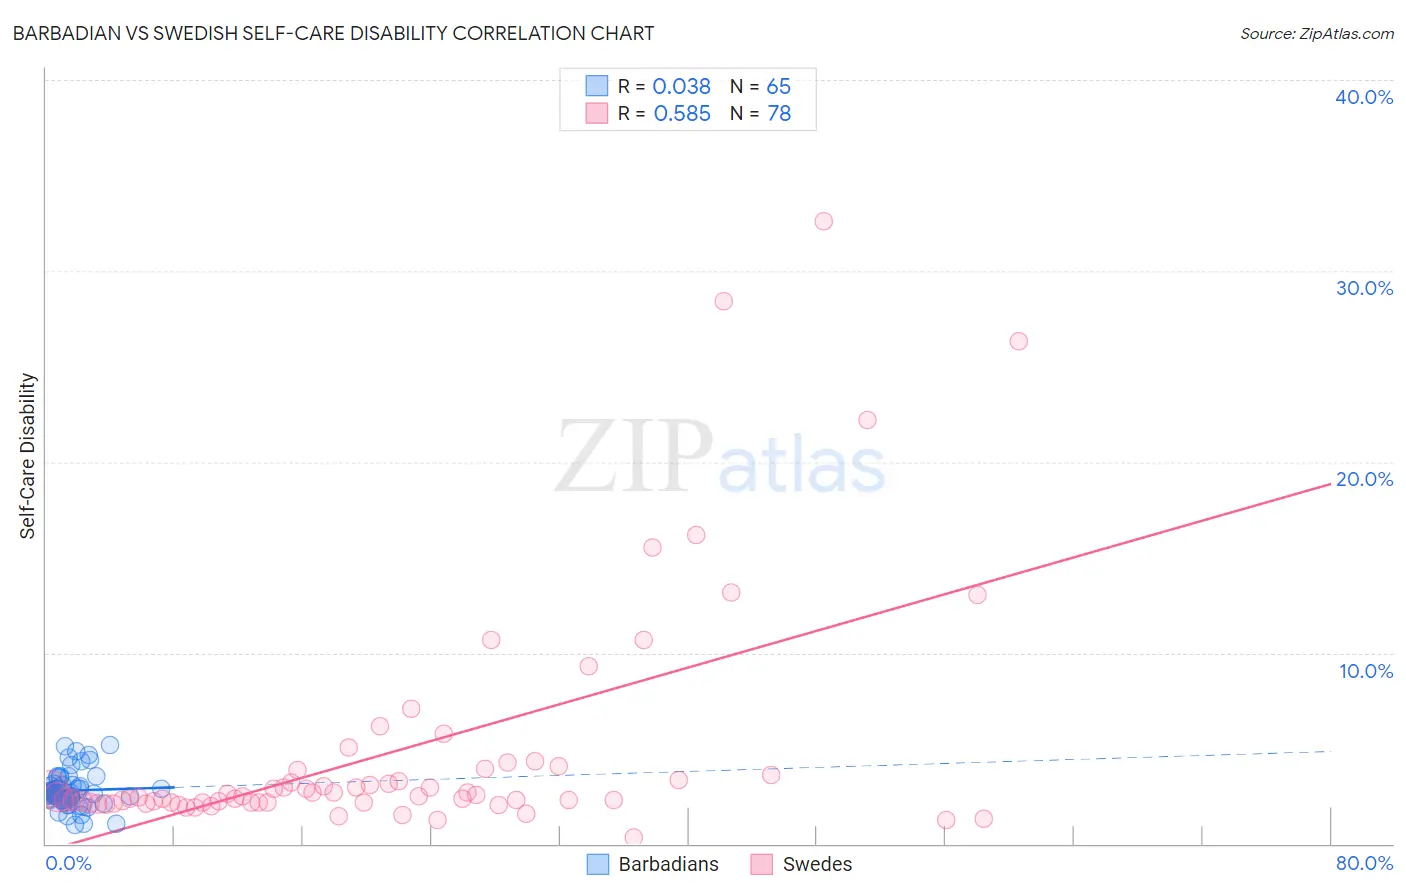
Barbadian vs Swedish Self-Care Disability Correlation Chart
The statistical analysis conducted on geographies consisting of 141,243,740 people shows no correlation between the proportion of Barbadians and percentage of population with self-care disability in the United States with a correlation coefficient (R) of 0.038 and weighted average of 2.7%. Similarly, the statistical analysis conducted on geographies consisting of 537,435,418 people shows a substantial positive correlation between the proportion of Swedes and percentage of population with self-care disability in the United States with a correlation coefficient (R) of 0.585 and weighted average of 2.3%, a difference of 18.4%.
Self-Care Disability Correlation Summary
| Measurement | Barbadian | Swedish |
| Minimum | 1.0% | 0.30% |
| Maximum | 5.2% | 32.6% |
| Range | 4.2% | 32.3% |
| Mean | 2.8% | 4.8% |
| Median | 2.7% | 2.5% |
| Interquartile 25% (IQ1) | 2.3% | 2.1% |
| Interquartile 75% (IQ3) | 3.1% | 3.9% |
| Interquartile Range (IQR) | 0.76% | 1.7% |
| Standard Deviation (Sample) | 0.90% | 6.2% |
| Standard Deviation (Population) | 0.90% | 6.2% |
Similar Demographics by Self-Care Disability
Demographics Similar to Barbadians by Self-Care Disability
In terms of self-care disability, the demographic groups most similar to Barbadians are Blackfeet (2.7%, a difference of 0.14%), Central American Indian (2.7%, a difference of 0.15%), Belizean (2.7%, a difference of 0.15%), Guyanese (2.7%, a difference of 0.31%), and Immigrants from Portugal (2.8%, a difference of 0.43%).
| Demographics | Rating | Rank | Self-Care Disability |
| Immigrants | Barbados | 0.0 /100 | #288 | Tragic 2.7% |
| Africans | 0.0 /100 | #289 | Tragic 2.7% |
| Cubans | 0.0 /100 | #290 | Tragic 2.7% |
| Guyanese | 0.0 /100 | #291 | Tragic 2.7% |
| Central American Indians | 0.0 /100 | #292 | Tragic 2.7% |
| Belizeans | 0.0 /100 | #293 | Tragic 2.7% |
| Blackfeet | 0.0 /100 | #294 | Tragic 2.7% |
| Barbadians | 0.0 /100 | #295 | Tragic 2.7% |
| Immigrants | Portugal | 0.0 /100 | #296 | Tragic 2.8% |
| West Indians | 0.0 /100 | #297 | Tragic 2.8% |
| Americans | 0.0 /100 | #298 | Tragic 2.8% |
| Immigrants | Guyana | 0.0 /100 | #299 | Tragic 2.8% |
| Immigrants | Fiji | 0.0 /100 | #300 | Tragic 2.8% |
| Pima | 0.0 /100 | #301 | Tragic 2.8% |
| Immigrants | St. Vincent and the Grenadines | 0.0 /100 | #302 | Tragic 2.8% |
Demographics Similar to Swedes by Self-Care Disability
In terms of self-care disability, the demographic groups most similar to Swedes are Mongolian (2.3%, a difference of 0.010%), Brazilian (2.3%, a difference of 0.060%), Egyptian (2.3%, a difference of 0.090%), Immigrants from Argentina (2.3%, a difference of 0.090%), and South African (2.3%, a difference of 0.12%).
| Demographics | Rating | Rank | Self-Care Disability |
| Immigrants | Belgium | 99.6 /100 | #57 | Exceptional 2.3% |
| Immigrants | Cameroon | 99.6 /100 | #58 | Exceptional 2.3% |
| New Zealanders | 99.5 /100 | #59 | Exceptional 2.3% |
| Immigrants | Japan | 99.5 /100 | #60 | Exceptional 2.3% |
| Palestinians | 99.4 /100 | #61 | Exceptional 2.3% |
| Egyptians | 99.4 /100 | #62 | Exceptional 2.3% |
| Mongolians | 99.3 /100 | #63 | Exceptional 2.3% |
| Swedes | 99.3 /100 | #64 | Exceptional 2.3% |
| Brazilians | 99.3 /100 | #65 | Exceptional 2.3% |
| Immigrants | Argentina | 99.3 /100 | #66 | Exceptional 2.3% |
| South Africans | 99.3 /100 | #67 | Exceptional 2.3% |
| Immigrants | Zaire | 99.2 /100 | #68 | Exceptional 2.3% |
| Immigrants | Norway | 99.2 /100 | #69 | Exceptional 2.3% |
| Immigrants | Northern Europe | 99.2 /100 | #70 | Exceptional 2.3% |
| Asians | 99.2 /100 | #71 | Exceptional 2.3% |