Zip Codes with the Highest Percentage of Population Employed in Installation, Maintenance & Repair in Newark, DE
RELATED REPORTS & OPTIONS
Installation, Maintenance & Repair
Newark
Compare Zip Codes
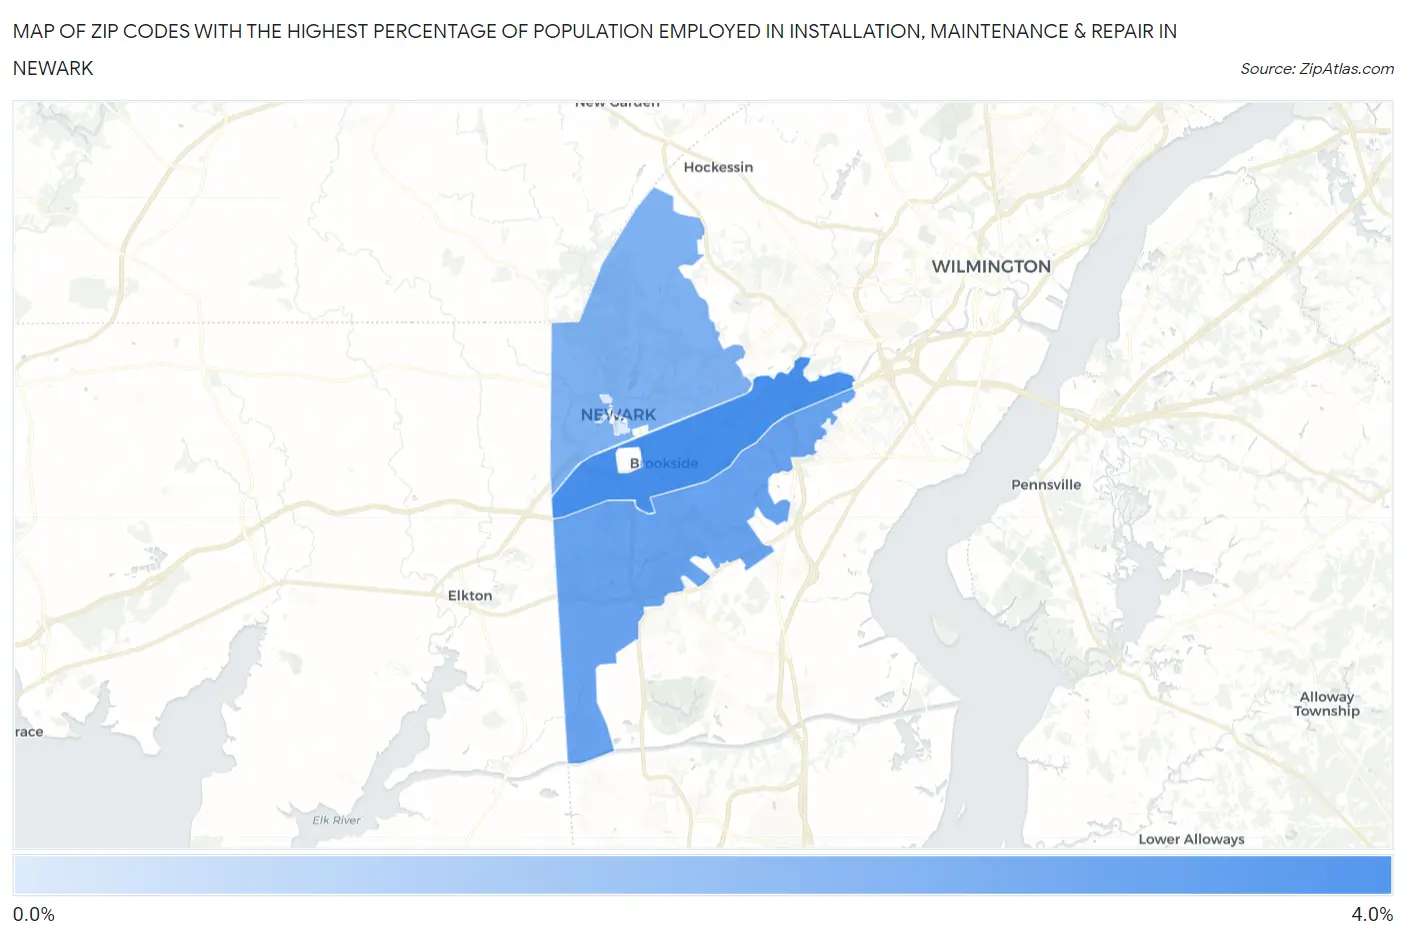
Map of Zip Codes with the Highest Percentage of Population Employed in Installation, Maintenance & Repair in Newark
0.33%
3.9%
Zip Codes with the Highest Percentage of Population Employed in Installation, Maintenance & Repair in Newark, DE
| Zip Code | % Employed | vs State | vs National | |
| 1. | 19713 | 3.9% | 3.4%(+0.434)#26 | 3.1%(+0.815)#12,878 |
| 2. | 19702 | 3.1% | 3.4%(-0.360)#40 | 3.1%(+0.021)#16,579 |
| 3. | 19711 | 2.5% | 3.4%(-0.912)#42 | 3.1%(-0.532)#19,373 |
| 4. | 19717 | 0.33% | 3.4%(-3.12)#57 | 3.1%(-2.74)#27,513 |
1
Common Questions
What are the Top 3 Zip Codes with the Highest Percentage of Population Employed in Installation, Maintenance & Repair in Newark, DE?
Top 3 Zip Codes with the Highest Percentage of Population Employed in Installation, Maintenance & Repair in Newark, DE are:
What zip code has the Highest Percentage of Population Employed in Installation, Maintenance & Repair in Newark, DE?
19713 has the Highest Percentage of Population Employed in Installation, Maintenance & Repair in Newark, DE with 3.9%.
What is the Percentage of Population Employed in Installation, Maintenance & Repair in Newark, DE?
Percentage of Population Employed in Installation, Maintenance & Repair in Newark is 2.2%.
What is the Percentage of Population Employed in Installation, Maintenance & Repair in Delaware?
Percentage of Population Employed in Installation, Maintenance & Repair in Delaware is 3.4%.
What is the Percentage of Population Employed in Installation, Maintenance & Repair in the United States?
Percentage of Population Employed in Installation, Maintenance & Repair in the United States is 3.1%.