Zip Codes with the Highest Percentage of Population Employed in Accommodation & Food Services in Newark, DE
RELATED REPORTS & OPTIONS
Accommodation & Food Services
Newark
Compare Zip Codes
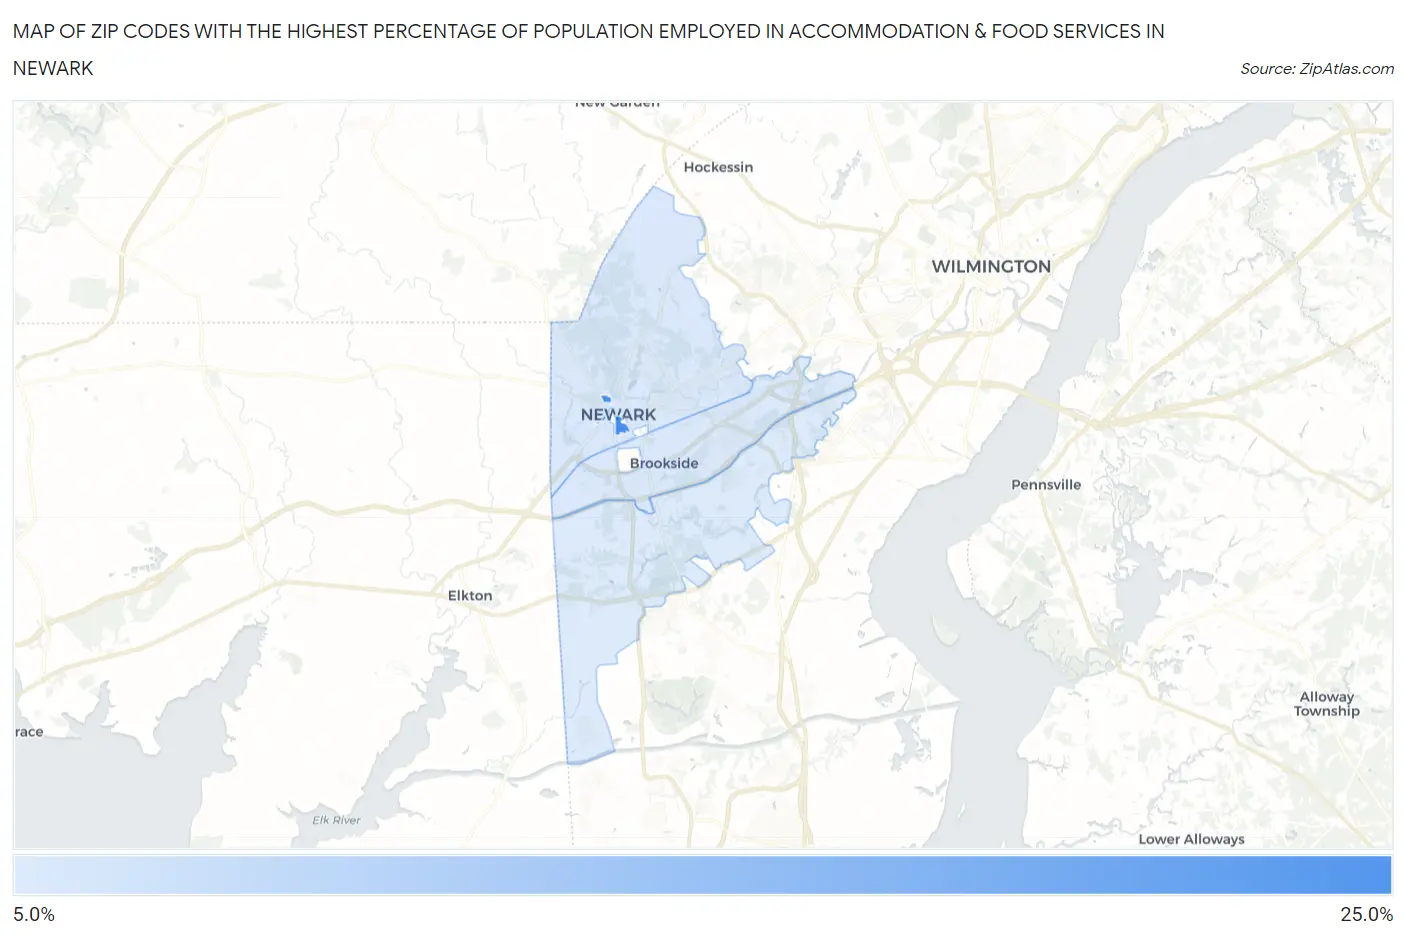
Map of Zip Codes with the Highest Percentage of Population Employed in Accommodation & Food Services in Newark
5.4%
23.9%
Zip Codes with the Highest Percentage of Population Employed in Accommodation & Food Services in Newark, DE
| Zip Code | % Employed | vs State | vs National | |
| 1. | 19717 | 23.9% | 6.3%(+17.6)#1 | 6.9%(+17.0)#566 |
| 2. | 19713 | 5.7% | 6.3%(-0.583)#32 | 6.9%(-1.14)#14,258 |
| 3. | 19711 | 5.6% | 6.3%(-0.688)#34 | 6.9%(-1.25)#14,577 |
| 4. | 19702 | 5.4% | 6.3%(-0.902)#36 | 6.9%(-1.46)#15,325 |
1
Common Questions
What are the Top 3 Zip Codes with the Highest Percentage of Population Employed in Accommodation & Food Services in Newark, DE?
Top 3 Zip Codes with the Highest Percentage of Population Employed in Accommodation & Food Services in Newark, DE are:
What zip code has the Highest Percentage of Population Employed in Accommodation & Food Services in Newark, DE?
19717 has the Highest Percentage of Population Employed in Accommodation & Food Services in Newark, DE with 23.9%.
What is the Percentage of Population Employed in Accommodation & Food Services in Newark, DE?
Percentage of Population Employed in Accommodation & Food Services in Newark is 8.5%.
What is the Percentage of Population Employed in Accommodation & Food Services in Delaware?
Percentage of Population Employed in Accommodation & Food Services in Delaware is 6.3%.
What is the Percentage of Population Employed in Accommodation & Food Services in the United States?
Percentage of Population Employed in Accommodation & Food Services in the United States is 6.9%.